[Preprint]. 2025 Aug 21:2025.08.14.670195.
doi: 10.1101/2025.08.14.670195.

Macrophages drive a fibrogenic gene program of periductal fibroblasts in pediatric primary sclerosing cholangitis

Affiliations

Macrophages drive a fibrogenic gene program of periductal fibroblasts in pediatric primary sclerosing cholangitis

Yunguan Wang et al. bioRxiv. .

Abstract

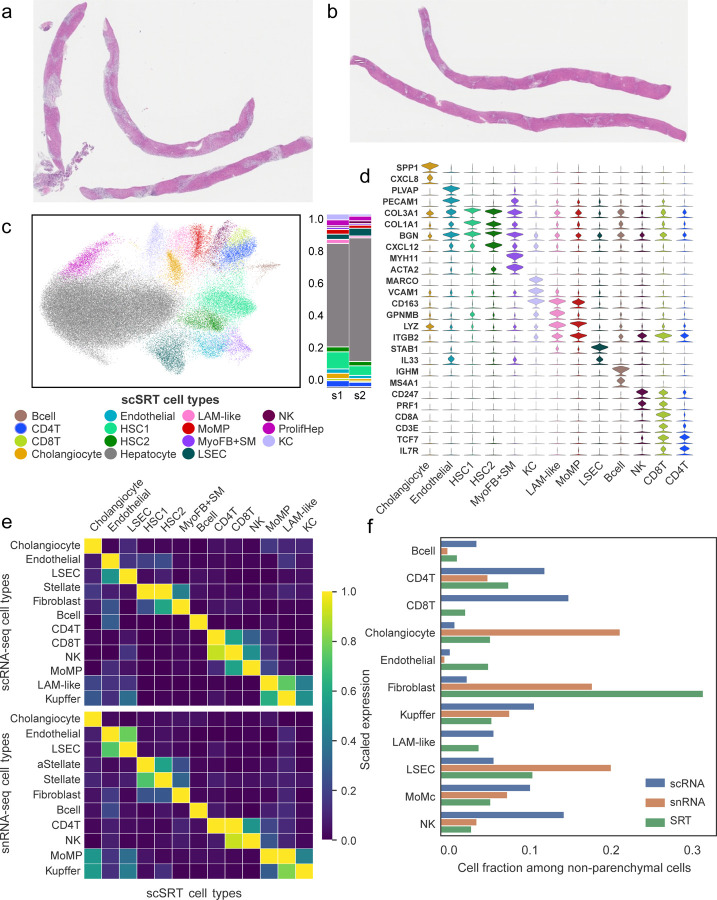
Primary sclerosing cholangitis (PSC) is an autoimmune, cholestatic liver disease characterized by inflammation and fibrosis surrounding bile ducts. The cellular crosstalk driving periductal fibrosis remains poorly defined. This study applied a multi-omics approach integrating MERSCOPE spatial transcriptomics, bulk RNA-seq, and SomaScan proteomics to characterize fibrotic periductal regions and their cell-cell communications. Macrophages (MP) expressing moderate-to-high CD163 were found co-localized with cholangiocytes, T cells, and collagen-producing hepatic stellate cells (HSC). Cell niche analysis identified periductal regions with elevated fibrotic signals, in which cell-cell communication analysis revealed MP-HSC interactions involving 17 fibrotic driver genes in MP (e.g., IFNGR1, CSF1R, CD163) and six fibrotic effector genes in HSC (e.g., COL1A2, VCAN, MMP2). In validation analyses, bulk RNA-seq data showed higher driver and effector gene scores in PSC with established fibrosis compared to early-stage PSC and autoimmune hepatitis (AIH). Plasma proteins encoded by MP driver genes were elevated in autoimmune liver disease (AILD) and in patients with elevated (≥3.29 kPa) liver stiffness on MR elastography. These findings suggest that macrophages engage in localized crosstalk with HSC, activating fibrotic gene programs and contributing to periductal fibrosis in PSC, thereby identifying potential molecular targets for therapeutic intervention.

Keywords: Primary sclerosing cholangitis; cell-cell communication; macrophage; periductal fibrosis; spatially resolved transcriptomics.


Figures

Figure 1.
Figure 1.
Analytical workflow for scSRT data analysis, integration, CCC prediction, and orthogonal validation.
Figure 2.
Figure 2.. Evaluation of the association between macrophage gene programs and liver fibrosis in PSC.
(a) Unsupervised clustering 64 AILD patient samples shown in embeddings calculated using the Uniform manifold approximation and projection (UMAP) algorithm. Samples were colored based on clusters (upper) or patient diagnosis at the time of data collection (lower). (b) Compositions of each patient sample cluster, based on diagnosis (left) or fibrosis stage (right). (c) Serum GGT (left), ALP (middle) and Bilirubin (right) levels in each patient cluster. (d) GSEA results calculated from the ranked differentially expressed genes in cluster 1 compared with c0 and c2. Pathways shown were selected based on an FDR q-value cutoff of 0.25, and colored based on the normalized enrichment scores (NES). Both the q-value and the NES were calculated using the gseapy Python package. (e) Average expression of genes involved in macrophage (MP) activation (left), and of marker genes for LAM, and MoMP (right) in each patient cluster. Values were normalized to a numeric range of 0–1. (d and e) Significance was obtained from the student’s t test comparing c1 vs the other patient clusters: *p <0.05, **p <0.01, ***p <0.001. Standard errors were shown as error bars.
Figure 3.
Figure 3.. Evaluation of the cell types identified in scSRT PSC samples.
(a and b) Overview of the two PSC samples used in this study. FFPE slides were stained with hematoxylin and eosin. Scale bar = 1mm. (c) PSC cell types identified using unsupervised clustering were shown in embeddings calculated using the UMAP algorithm. Samples were colored based on cell types. (d) Violin plot showing expression of selected marker genes of each cell type. Each violin was colored based on cell types shown in panel c. (d) Average expression of top 5 DEG from each scSRT cell type (rows) in scRNA-seq cell types (columns) in reference scRNA-seq (top) and snRNA-seq (bottom) datasets. Log1p(CPM) gene expression values were scaled to a range of 0 to 1. (f) Fractions of each cell type among all non-hepatocytes in scSRT and scRNA-seq data.
Figure 4.
Figure 4.. Neighborhood analysis of PSC fibrotic cell niches.
(a) A region with onion skin fibrosis on a consecutive slice from the same tissue used in scSRT profiling; (b) A reconstructed image focusing on a region with onion skin fibrosis using scSRT data. Polygons in the image represent segmented cell masks and are colored based on cell types. (c) Heatmap showing neighborhood enrichment scores (NES) between each evaluated neighboring cell type (columns) in the proximity of the reference cell type (rows). Each cell in the heatmap is colored based on the log2(NES) value. (d) Reconstructed image showing the location of each cell in the scSRT data. Cells are shown as dots on the image and colored based on their niche identity. (e) Stacked bar plot showing the fraction of each cell type among all cells included the fibrotic and non-fibrotic niches. (f) Top 5 DEG for the fibrotic and non-fibrotic niches. Differential analysis was performed using the Wilcoxon’s rank sum test with FDR-adjusted p-value cutoff at 0.05. DEGs were ranked using log fold changes. (g) Reconstructed image of cells in scSRT data showing the location of periductal regions. (h) PCA plot calculated from the pseudobulk level expression profiles from periductal regions. Pseudobulks are colored based on its HSC1 fraction. (i) Boxplot showing the enrichment of cell types in the high-fibrosis regions compared to the low-fibrosis regions. Significance obtained from the student’s t test across the two groups. *p <0.05, **p <0.01, ***p <0.001. (j) Stacked violin plot of genes upregulated in the high-fibrosis periductal regions. Differential analysis was performed in each cell type using the Wilcoxon’s rank sum test. DEG were filtered based on FDR-adjusted p-value cutoff at 0.05 and min. log fold change of 0.6.
Figure 5.
Figure 5.. CCC analysis of periductal fibrotic niches in PSC.
(a) Circos plot summarizing HSC1-targeting CCC from macrophages, T cells, and cholangiocytes. Each band represents a CCC between the sender cell and HSC1. The bar plot below each gene in the middle track represents the sum of absolute β values of each CCC involving this gene. CCC were predicted between HSC1 (receiver cell) and macrophages/T cells/cholangiocytes (sender cell). (b) Venn diagram showing the 20 HSC1 genes targeted by sender cells. (c) Reconstructed images of representative low- and high-fibrosis periductal regions. Polygons in the image represent segmented cell masks, and are colored based on cell types. CCC between cells are shown as directed arrows. (d) Comparison of primary instance (PI) scores in HSC1 fibrogenic genes between low- and high- fibrosis periductal regions. Standard deviations are shown as error bars. Colors of bars represent cell types shown in panel (c). *p <0.05, **p <0.01, ***p <0.001. (e) CCC network focusing on HSC1 fibrogenic genes. Nodes with spiky borders represent genes expressed by sender cells, and nodes with smooth borders represent HSC1 genes. Nodes are colored based on cell types. CCC are shown as directed edges, and the absolute β values are positively proportional to edge thickness.
Figure 6.
Figure 6.. Orthogonal validation of effector and driver fibrotic signatures.
(a) In silico validation of fibrotic driver and effector score in bulk liver RNA-seq data from healthy controls (HC) and adult patients with PSC. (b) Fibrotic driver and effector score in pediatric PSC patients with early or advanced stages of fibrosis, which is defined as METAVIR>=2 or Ishak >=3. (c) Pearson correlation between fibrotic driver scores calculated in macrophages and fibrotic effector scores calculated in fibroblasts. (d) Comparison between baseline correlation between macrophage- and fibroblast- DEGs, and correlation between the fibrotic driver and effector scores. Blue line represents the distribution of the baseline correlation in 1000 simulations using randomly sampled DEGs. Orange line represents the observed correlation between the fibrotic driver and effector scores, calculated in macrophage and fibroblasts, respectively. (e) Boxplot showing proteins that are elevated in PSC/AIH compared to HC in plasma. Statistical test was done using One-way Anova. (f) Bile duct injury and liver stiffness measures in AILD patients with high- or low- average plasma concentrations for fibrotic driver markers. All error bars represent standard deviation. *p <0.05, **p <0.01, ***p <0.001.

References

    1. Liu JZ, Hov JR, Folseraas T, Ellinghaus E, Rushbrook SM, Doncheva NT, et al. Dense genotyping of immune-related disease regions identifies nine new risk loci for primary sclerosing cholangitis. Nat Genet. 2013;45(6):670–5. - PMC - PubMed
    1. Deneau MR, El-Matary W, Valentino PL, Abdou R, Alqoaer K, Amin M, et al. The natural history of primary sclerosing cholangitis in 781 children: A multicenter, international collaboration. Hepatology. 2017;66(2):518–27. - PubMed
    1. Laborda TJ, Jensen MK, Kavan M, and Deneau M. Treatment of primary sclerosing cholangitis in children. World J Hepatol. 2019;11(1):19–36. - PMC - PubMed
    1. Dotan M, Fried S, Har-Zahav A, Shamir R, Wells RG, and Waisbourd-Zinman O. Periductal bile acid exposure causes cholangiocyte injury and fibrosis. PLoS One. 2022;17(3):e0265418. - PMC - PubMed
    1. Ceci L, Gaudio E, and Kennedy L. Cellular Interactions and Crosstalk Facilitating Biliary Fibrosis in Cholestasis. Cell Mol Gastroenterol Hepatol. 2024;17(4):553–65. - PMC - PubMed

Publication types