[Preprint]. 2025 Aug 20:2025.08.20.671369.
doi: 10.1101/2025.08.20.671369.

Visualizing Poloidal Orientation in DNA Minicircles

Affiliations

Visualizing Poloidal Orientation in DNA Minicircles

Tony Lemos et al. bioRxiv. .

Abstract

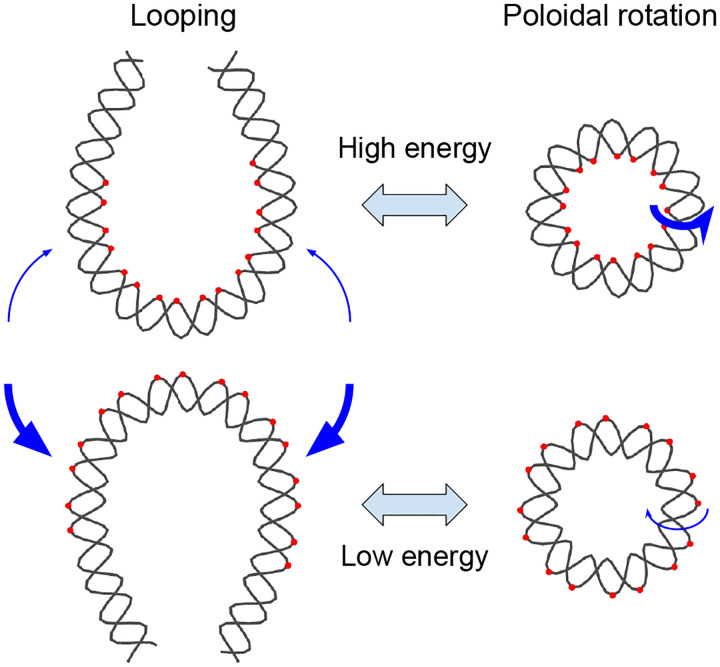
A short (<150 bp) double-stranded DNA (dsDNA) molecule ligated end-to-end forms a DNA minicircle. Due to sequence-dependent, nonuniform bending energetics, such a minicircle is predicted to adopt a certain inside-out orientation, known as the poloidal orientation. Despite theoretical and computational predictions, experimental evidence for this phenomenon has been lacking. In this study, we introduce a single-molecule approach to visualize the poloidal orientation of DNA minicircles. We constructed a set of DNA minicircles, each containing a single biotin located at a different position along one helical turn of the dsDNA, and imaged the location of biotin-bound NeutrAvidin relative to the DNA minicircle using atomic force microscopy (AFM). We applied this approach to two DNA sequences previously predicted to exhibit strongly preferred poloidal orientations. The observed relative positions of NeutrAvidin shifted between the inside and outside of the minicircle with different phases, indicating distinct poloidal orientations for the two sequences. Coarse-grained simulations revealed narrowly distributed poloidal orientations with different mean orientations for each sequence, consistent with the AFM results. Together, our findings provide experimental confirmation of preferred poloidal orientations in DNA minicircles, offering insights into the intrinsic dynamics of circular DNA.


Conflict of interest statement

DECLARATION OF INTEREST The authors declare no competing interests.

Figures

Figure 1.
Figure 1.
Correspondence between DNA looping direction and poloidal orientation. For conceptual clarity, two opposite looping directions of a double-stranded DNA are illustrated. The loops are depicted in a teardrop shape, representing the minimum-energy conformation. Blue arrows indicate the direction of looping with thickness proportional to the relative frequency, and red dots mark the innermost or outermost atoms in highly bent regions. Due to sequence-dependent bending rigidity, the energetic cost of bending differs between the two directions. As a result, one looping direction is energetically favored over the other. On the right, DNA minicircles are shown with poloidal orientations corresponding to the two looped conformations. These poloidal orientations exhibit a similar energy difference, leading to a preferred orientation consistent with the favored looping direction. Blue arrows indicate poloidal rotations, and their thickness represents the relative frequency.
Figure 2.
Figure 2.
Analysis of images collected from AFM experiments. (a) Procedure for selecting DNA–protein images from the initial collection of images. A subset of images representing lone minicircles, lone proteins, or aggregates is discarded based on area and intensity thresholds (gray boxes). The remaining images are manually inspected to distinguish DNA–protein complexes (red dots) from other types (blue dots). Representative molecules from each category are shown. (b) Calculation of offset distance δ. From each selected DNA–protein image, the centroid rcentroid (red ×) and the center of mass rCOM (green ×) were computed based on the pixel mask of the DNA–protein complex. The offset distance δ was defined as the Euclidean distance between rcentroid and rCOM.
Figure 3.
Figure 3.
Schematic of poloidal bias visualization using AFM. (a) A DNA minicircle with a biotin-containing segment (gray) inserted at position i. Suppose the DNA minicircle has a preferred poloidal orientation, which corresponds to an outward orientation of the biotin. Due to this outward orientation, biotin-bound NeutrAvidin will appear at the outside location, as shown by the AFM image to the right. (b) A DNA minicircle, identical to the previous one except that the biotin segment is shifted by half a helical period to position i+h/2. Here, the biotin is more likely to face inward due to the preferred poloidal orientation of the DNA minicircle. This will result in NeutrAvidin appearing at the inside location, as shown by the AFM image to the right.
Figure 4.
Figure 4.
Colocalization of DNA minicircle and NeutrAvidin with and without biotin. (a) An AFM image of biotinylated DNA minicircles (+Biotin) incubated with NeutrAvidin is shown on the left, and a corresponding image of non-biotinylated DNA minicircles (−Biotin) is shown on the right. Arrows indicate examples of DNA (D), protein (P), and DNA–protein complexes (DP). Larger loops in the AFM images represent circular dimers, which are by-products of the ligation protocol and are excluded from analysis. (b) Number statistics of different molecule types per scan area. The table shows the mean and standard deviation for each molecule type observed in +Biotin and −Biotin samples. The calculated relative affinity (α) values are also listed.
Figure 5.
Figure 5.
Offset distances δ extracted from AFM images of DNA-protein complexes. The distribution of δ is shown as a violin plot. The circle represents the median, and the vertical line indicates the standard deviation. (a) Offset distances from DNA minicircles of the 601 series. A sinusoidal fit (red dashed line) to the plot yields a peak at insert position 1.3. (b) Offset distances from DNA minicircles of the A-tract series. A sinusoidal fit to the plot yields a peak at insert position 6.8.
Figure 6.
Figure 6.
Poloidal-angle statistics of DNA minicircles obtained from MADna simulations. The statistics were computed based on the phosphate atom closest to the biotin-linked dT. (a) Polar plot of the mean and standard deviation of poloidal angles for 601 series. Blue circles represent the mean angles, while red arcs indicate their standard deviations. The number adjacent to each point indicates the insert position. Data points for different insert positions are radially distributed for visual clarity. (b) Polar plot of the mean and standard deviation of poloidal angles for minicircles in the A-tract series. (c) Mean and standard deviation of the inverted horizontal position (-x) of the phosphate atom for the 601-series minicircles. x is inverted to trend in the same direction as δ extracted from AFM images. Blue circles represent the horizontal displacement relative to the helical axis (the origin in the polar plot), and error bars indicate standard deviations. The red dashed curve shows a sinusoidal fit to the means, weighted by their errors, with a fixed period of 10.5. The fit curve has a peak at insert position 4. (d) Same as (c), but for the A-tract series minicircles. The fit curve has a peak at insert position 10.5.

References

    1. Dickerson R. E., Dna bending: the prevalence of kinkiness and the virtues of normality, Nucleic acids research 26, 1906 (1998). - PMC - PubMed
    1. Ma N. and van der Vaart A., Anisotropy of b-dna groove bending, Journal of the American Chemical Society 138, 9951 (2016). - PubMed
    1. Basu A., Bobrovnikov D. G., Qureshi Z., Kayikcioglu T., Ngo T. T., Ranjan A., Eustermann S., Cieza B., Morgan M. T., Hejna M., et al. , Measuring dna mechanics on the genome scale, Nature 589, 462 (2021). - PMC - PubMed
    1. Jeong J. and Kim H. D., Determinants of cyclization–decyclization kinetics of short dna with sticky ends, Nucleic acids research 48, 5147 (2020). - PMC - PubMed
    1. Yoo J., Park S., Maffeo C., Ha T., and Aksimentiev A., Dna sequence and methylation prescribe the inside-out conformational dynamics and bending energetics of dna minicircles, Nucleic acids research 49, 11459 (2021). - PMC - PubMed

Publication types

LinkOut - more resources