[Preprint]. 2025 Aug 19:2024.10.28.620763.
doi: 10.1101/2024.10.28.620763.

Deregulating m6A regulators leads to altered RNA biology in glioma cell lines

Affiliations

Deregulating m6A regulators leads to altered RNA biology in glioma cell lines

Syeda Maheen Batool et al. bioRxiv. .

Abstract

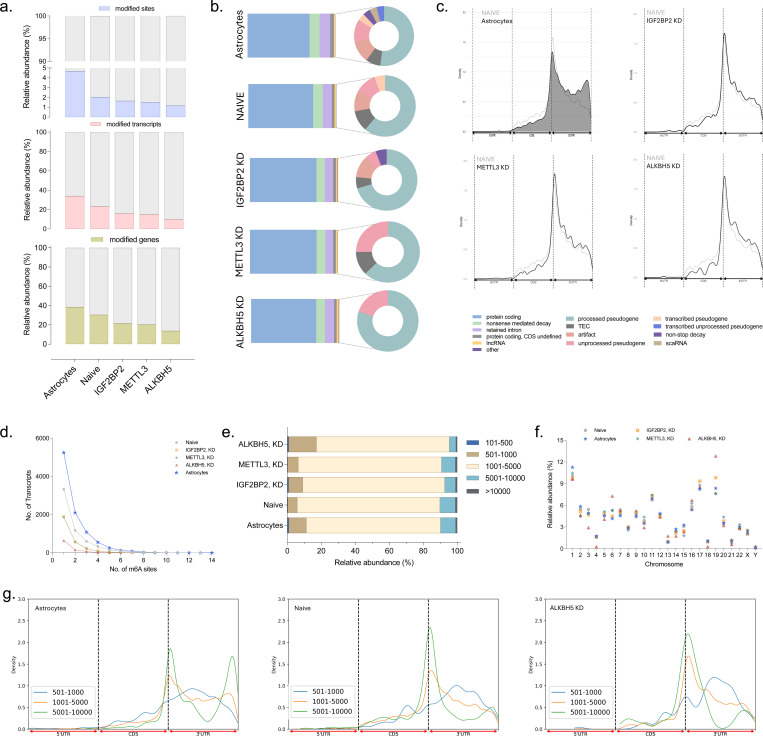
N6-methyladenosine (m6A) is the most prevalent internal mRNA modification, enriched in the CNS yet poorly characterized in glioma. Using long-read RNA sequencing, we mapped m6A in an in vitro glioma model following knockdown (KD) of the reader IGF2BP2, writer METTL3, and eraser ALKBH5, with naive glioma cells and astrocytes as controls. Glioma cells exhibited a two-fold reduction in global m6A, suggesting progressive loss from healthy to malignant states. Integrated analysis revealed that m6A mediated control of gene expression is influenced by modification topology (CDS:3'UTR), transcript biotype, and length. Regulator KD, particularly ALKBH5 induced redistribution of m6A toward 3'UTR with consequent gene upregulation. We also identified m6A-mediated isoform switching, with a higher usage of retained intron and nonsense-mediated decay isoforms. Structural and splicing alterations at the isoform level were identified unique to each KD condition indicating m6A driven aberrant alternative splicing. At the functional level, KD specific remodeling of oncogenic signaling was also observed. ALKBH5 KD suppressed MYC targets and pro-apoptotic signaling while METTL3 KD enhanced mTOR and PI3K-AKT signaling. Collectively, these results demonstrate that m6A mediated regulation in glioma is highly context-dependent, defining distinct clinically relevant phenotypes. This has implications for future biomarker discovery and development of targeted therapeutics.

Keywords: N6-methyladenosine (m6A); RNA; alternative splicing; epitranscriptomics; glioma; isoform; signaling.


Conflict of interest statement

Competing interests None of the authors declare any competing interests.

Figures

Figure 1.
Figure 1.. Transcriptome wide profiling m6A in glioma cell line.
(a) Schematic depicting cell transfection with silencer RNA (siRNA) to achieve knockdown (KD) of key m6A regulators: IGF2BP2 (reader), METTL3 (writer), ALKBH5 (eraser). RNA isolated from control (naïve, astrocytes) and KD cells on day 9 sequenced using Nanopore direct RNA sequencing platform. Three technical replicates were sequenced per condition. (b) Total and (c) Mapped reads across the three replicates of cell RNA sequenced from glioma and KD conditions. (d) Assessment of percentage mapped vs. unmapped reads (e) Distribution analysis of the detected RNA biotypes from control and KD conditions. (f) Assessment of variance in the cell RNA detected transcripts using principal component analysis (PCA). (g) Distribution analysis of the detected RNA biotypes from control and KD conditions.
Figure 2:
Figure 2:. Quantification of m6A-modified RNA biotypes and transcript distribution.
(a) Bar chart summarizing the relative abundance of m6A modified sites, transcripts, and genes for ALKBH5 KD, IGF2BP2 KD, METTL3 KD, naive, and astrocytes condition. (b) Pie chart depicting the m6a modified transcript biotype distribution in each condition (n=5). (c) KDE distribution of localization of m6A modified sites in the 5’UTR, CDS, and 3’UTR transcript regions in each KD condition (n=3) and Astrocytes (dark gray) in comparison to Naive (light gray). (d) Distribution of transcripts by number of m6A sites across experimental conditions, The y-axis indicates the number of transcripts, and the x-axis shows the number of m6A sites per transcript. (e) Stacked bar chart demonstrating the relative abundance of m6A modified RNA fragment length in each condition. (f) Scatter plot showcasing the chromosomal distribution of m6A modified genes. (g) Density plots of m6A distribution along the transcript region, stratified by RNA length.
Figure 3:
Figure 3:. Relationship between m6A methylation, gene expression, transcript regions, and pathways across ALKBH5 KD, IGF2BP2 KD, METTL3 KD, and Naive conditions.
(a) Venn diagram of the common and unique m6A modified sites, transcripts, and genes across the four conditions, respectively. N = 578 transcripts are used for downstream analysis. (b) Scatter plots illustrating the m6A methylation vs. differential gene expression of commonly m6A modified genes. The x-axis represents the log2 fold change (FC) in m6A methylation levels, while the y-axis denotes the log2 FC of differentially expressed genes (DGEs). DGEs with Log2 FC > 0.58 or < −0.58 and p-value < .05 are highlighted in red, while non-significant ones are shown in gray. (d) Line graph showcasing the ratio of abundance of CDS over 3’UTR in commonly modified m6A genes highlighting the relationship with gene expression and methylation in each knockdown comparison. (d) Scatter plots of selected pathways containing commonly m6A modified genes and displaying differential methylation and gene expression levels between in each knockdown condition compared to naive.
Figure 4:
Figure 4:. Quantification of unique m6A modified sites, transcripts, and genes.
(a) Grouped bar chart displaying the number of unique m6A modified sites, transcripts, and genes in each KD cell and the naive condition. (b) Pie charts representing the proportion of 5’UTR, CDS, and 3’UTR in uniquely modified m6A transcripts for each KD condition (n=3) and the naive condition. (c) Line graphs showing the transcript region density in ALKBH5 knockdown, IGF2BP2 knockdown, and METTL3 knockdown (blue) in comparison to naive (gray). (d) k-mer distribution in each knockdown comparison and naive. (e) Scatter plot depicting the chromosomal distribution in each m6A regulator knockdown when compared to naive. (f-k) Scatter plots of the m6A modified ratio (x-axis) against the log2 fold change to showcase the correlation between methylation and gene expression. Yellow represents METTL3 knockdown, red represents IGF2BP2 knockdown, and blue represents ALKBH5 knockdown.
Figure 5:
Figure 5:. Distribution analysis of m6A regulators, RNA splicing and decay factors across naive and KD cellular states.
(a) Heatmaps summarizing the differential gene (left) and transcript (right) expression for m6A regulators. Each row represents a specific m6A RNA regulator gene/transcript and the columns represent the log2 fold change of expression for the seven pairwise comparisons. For KD conditions vs Naïve, orange indicates gene/transcript upregulation in the KD condition and purple indicates upregulation in the Naïve condition. For Naïve vs Astrocytes, orange indicates upregulation in Naïve and purple indicates upregulation in Astrocytes. Significant differential expression is indicated with a star and transcript biotypes are provided in the row annotations. (b) Heatmap depicting RNA splicing and decay factors in relation with gene expression. For KD conditions vs Naïve, red indicates gene/transcript upregulation in the KD condition and blue indicates upregulation in the Naïve condition. For Naïve vs Astrocytes, red indicates upregulation in Naïve and blue indicates upregulation in Astrocytes. Genes with significant changes in expression are highlighted with a star.
Figure 6:
Figure 6:. Quantification of Isoform Switching events and its correlation to gene and isoform expression.
(a) Pie chart quantifying the isoforms switches occurring between each KD condition and astrocytes compared to naïve condition. (b) Stacked bar chart indicating the biotype distribution of isoforms that are used more in KDs and astrocytes compared to naive. (c) Isoform switching of ALKBH5–201 and ALKBH5–202 in astrocytes and KD when compared to naïve glioma cells. (d) Scatter plots of the log2 fold change at the isoform and the gene level of isoforms that are used more in the ALKBH5 knockdown, IGF2BP2 knockdown, and METTL3 knockdown. (e) Isoform switch consequence plots that highlight the effect an isoform causes for the knockdown conditions. The x-axis depicts the ratio of number of genes with the specific consequence over the total number of genes effected by that consequence with the y-axis specifying the consequence.
Figure 7:
Figure 7:. The relationship between selected genes in enriched pathways and the effect on gene expression and methylation.
(a-f) Heatmaps (left) for selected significantly enriched gene ontology pathways where each row represents a gene involved in the specific pathway. The x-axis indicates the log2 fold change in gene expression between each group. Positive log2 fold change value indicate an upregulation in condition 1 and negative log2 fold change values indicate upregulation in condition 2. The heatmap (right) also displays the relation between selected genes and the m6A methylation levels in specified enriched pathways. (g) Correlation analysis between m6A methylation in transcripts and gene expression in Knockdown (KD) vs Naïve glioma cells in selected pathways.

Similar articles

References

    1. Jiang X. et al. The role of m6A modification in the biological functions and diseases. Signal Transduct Target Ther 6, 74 (2021). - PMC - PubMed
    1. Akhtar J., Lugoboni M. & Junion G. mA RNA modification in transcription regulation. Transcription 12, 266–276 (2021). - PMC - PubMed
    1. Huang W. et al. N6-methyladenosine methyltransferases: functions, regulation, and clinical potential. J. Hematol. Oncol . 14, 117 (2021). - PMC - PubMed
    1. Jiang L., Li X., Wang S., Yuan Z. & Cheng J. The role and regulatory mechanism of mA methylation in the nervous system. Front. Genet . 13, 962774 (2022). - PMC - PubMed
    1. Fan Y., Lv X., Chen Z., Peng Y. & Zhang M. m6A methylation: Critical roles in aging and neurological diseases. Front Mol Neurosci 16, 1102147 (2023). - PMC - PubMed

Publication types

LinkOut - more resources