[Preprint]. 2025 Aug 19:2025.08.14.669892.
doi: 10.1101/2025.08.14.669892.

Cellular and Molecular Architecture of Renin-Angiotensin System Signaling in the PVN Under Cardiometabolic Stress

Affiliations

Cellular and Molecular Architecture of Renin-Angiotensin System Signaling in the PVN Under Cardiometabolic Stress

Haifeng Zheng et al. bioRxiv. .

Abstract

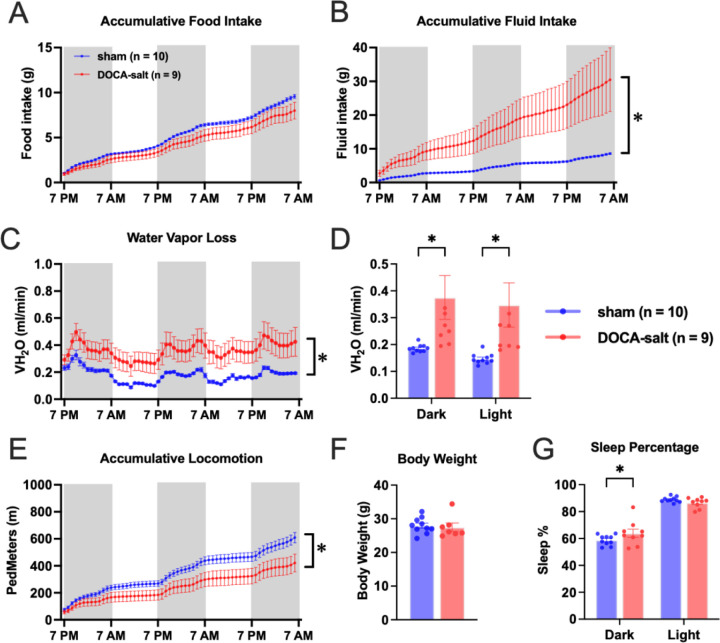
The hypothalamic paraventricular nucleus (PVN) integrates neuroendocrine and autonomic signals that regulate blood pressure and metabolism. Although the renin-angiotensin system (RAS) is implicated in neurogenic hypertension and obesity, cell-type-specific expression and regulation of its components within the PVN remain poorly understood. Here, we employed single-nucleus RNA sequencing (snRNA-seq) to profile the transcriptomic landscape of the PVN in male mice under baseline conditions and in models of DOCA-salt-induced hypertension and high-fat diet (HFD)-induced obesity. We identified major PVN cell types, including neurons, astrocytes, precursor oligodendrocytes, oligodendrocytes, microglia and endothelial cells, and further resolved eight transcriptionally distinct neuronal subtypes. Expression of RAS-related genes was highly cell-type specific: Agt (angiotensinogen) was enriched in astrocytes, whereas Ace (angiotensin-converting enzyme), Atp6ap2 (also known as the (pro)renin receptor [PRR]), Agtr1a (angiotensin II type 1a receptor, aka AT1aR), Lnpep (leucyl/cystinyl aminopeptidase, aka angiotensin 4 receptor [AT4R]), and the Mas1 proto-oncogene were predominantly expressed in neurons. DOCA-salt treatment increased the proportion of GABAergic and vasopressin neurons and enhanced neuronal Agt and Atp6ap2 expression, while reducing astrocytic Agt, suggesting activation of a vasoconstrictive RAS axis. HFD exposure increased excitatory and stress-responsive neuronal subtypes (glutamatergic, vasopressin, corticotropin-releasing hormone) and upregulated Atp6ap2, Agtr1b, Lnpep, and Mas1 in vasopressin neurons, while downregulating multiple RAS genes in GABAergic neurons. These findings reveal dynamic, cell-type-specific remodeling of RAS signaling in the PVN in response to hypertensive and metabolic stress, providing a transcriptomic atlas of RAS expression in the PVN and identifying potential cellular targets for therapeutic strategies addressing cardiometabolic disorders.

Keywords: DOCA-salt–induced hypertension; high-fat diet–induced obesity; hypothalamic paraventricular nucleus; renin-angiotensin system; single-nucleus RNA sequencing.


Figures

Figure 1.
Figure 1.. Overview of experimental workflow for snRNA-seq analysis of the PVN.
Illustration of the step-by-step procedure: ① Mice underwent either SHAM or DOCA-salt treatment for 2 weeks or were fed a CD or HFD for 6 weeks. ② Brain tissue containing the PVN was carefully dissected. ③ Single-nucleus isolation was performed to obtain individualized cells from dissected PVN tissues. ④ Single nuclei were encapsulated with barcoded beads in droplets to generate Gel Beads-in-Emulsion (GEMs). ⑤ Reverse transcription within GEMs produced cDNA. ⑥ cDNA libraries were prepared and indexed for sequencing. ⑦ Sequencing was performed using a next-generation sequencing platform. ⑧ Data analysis was carried out, including clustering of cell populations using dimensionality reduction techniques (e.g., t-SNE), enabling the identification of distinct cellular subpopulations within the PVN. Figure created using BioRender.
Figure 2.
Figure 2.. Cellular Composition and Transcriptomic Profiles of the RAS in the PVN Revealed by snRNA-seq.
(A) t-SNE visualization demonstrating distinct clustering of major cell types identified in the PVN from mice fed a CD. (B) Pie chart showing the proportional distribution of major cell populations within the PVN. Numbers represent the total cell count for each population. (C) Violin plots illustrating the expression distribution of key RAS genes across different PVN cell types. Cell types are color-coded according to the legend provided.
Figure 3.
Figure 3.. Neuronal subtype-specific expression patterns of RAS-related genes in the PVN.
(A) t-SNE visualization illustrating the clustering of distinct neuronal subtypes based on their transcriptomic profiles. (B) Pie chart displaying the proportional distribution of neuronal subtypes within the PVN. (C) Violin plots demonstrating the differential expression of RAS genes across identified neuronal subtypes. Colors correspond to neuronal subtypes, as indicated in the legend.
Figure 4.
Figure 4.. Effects of DOCA-salt treatment on metabolic and behavioral parameters.
Mice were administered DOCA-salt (red; n = 9) or sham treated (blue; n = 10), and housed in metabolic cages for continuous monitoring from day 12 to 14 of DOCA or sham treatment. (A) Cumulative food intake. (B) Cumulative fluid intake (sham, water intake; DOCA-salt, 0.9% saline intake). (C, D) VH2O loss, a proxy for thermoregulatory and respiratory water loss, over a 72-hour period (C) and average water vapor loss for 12/12 hours of dark and light cycles (D). (E) Locomotor activity measured as cumulative distance traveled (ped meters). (F) Body weight. (G) Average sleep percentage for 12/12 hours of dark and light cycles. Data are presented as means ± SEM (P < 0.05 vs. sham).
Figure 5.
Figure 5.. Effects of DOCA-salt treatment on whole-body energy metabolism and substrate utilization.
Energy expenditure (EE), oxygen consumption (VO2), carbon dioxide production (VCO2), and respiratory exchange ratio (RER), measured in mice administered DOCA-salt (red; n = 9) or sham treated (blue; n = 10), and housed in metabolic cages for continuous monitoring from day 12 to 14 of DOCA or sham treatment. (A, B) Absolute EE over 72 hours (A) and an average over 12/12 hours of dark and light cycles (B). (C) EE normalized to body weight. (D, E) Absolute VO2 over 72 hours (D) and an average over 12/12 hours of dark and light cycles (E). (F) weight-normalized VO2. (G, H) VCO2 levels over 72 hours (F) and an average over 12/12 hours of dark and light cycles (H). (I) VCO2 normalized to body weight. (J, K) RER over 72 hours (J) and an average over 12/12 hours of dark and light cycles (K). Data are presented as means ± SEM (*P < 0.05, ***P < 0.001 vs. SHAM).
Figure 6.
Figure 6.. Impact of DOCA-salt treatment on cellular composition and neuronal subtypes in the PVN as revealed by snRNA-seq.
(A) tSNE visualizations illustrating cell clustering and distribution of major PVN cell types. (B) Pie charts showing quantitative shifts in major cell populations due to DOCA-salt treatment, with significant increases in oligodendrocytes and decreases in neuronal proportions compared with SHAM. (C) tSNE visualizations depicting neuronal subtype distributions in SHAM and DOCA-salt treated mice. (D) Pie charts demonstrating significant alterations in neuronal subtype proportions under DOCA-salt conditions, with increases in GABAergic and vasopressin neurons and a marked reduction in glutamatergic neurons compared with SHAM. Colors correspond to neuronal subtypes and cell types, as indicated in the respective legends. Data are presented as means ± SEM (***P < 0.001 vs. SHAM; Fisher’s exact test).
Figure 7.
Figure 7.. DOCA-salt treatment alters the cellular distribution of RAS gene expression in the PVN.
Pie charts illustrating changes in the proportions of different PVN cell types expressing specific RAS genes in SHAM and DOCA-salt–treated mice. Numbers in the center of each pie chart represent the total counts of cells expressing each gene. Percentages indicate the proportion of each cell type among the cells expressing a given gene. Top panel: Shift in the cellular distribution of Agt expression with DOCA-salt treatment, with decreased proportions in astrocytes and increased proportions in neurons. Bottom panel: Shift in Atp6ap2 expression following DOCA-salt treatment, with increased proportions of neurons expressing Atp6ap2. Colors denote cell types according to the provided legend. Data are presented as means ± SEM (*P < 0.01, **P < 0.001 for SHAM vs. DOCA-salt; Fisher’s exact test).
Figure 8.
Figure 8.. DOCA-salt treatment alters neuronal subtype-specific expression patterns of RAS genes in the PVN.
Pie charts illustrating the proportions of neuronal subtypes expressing key RAS genes in SHAM and DOCA-salt–treated mice. The numbers in the center of each pie chart indicate the total number of neurons expressing each specific RAS gene, while percentages represent the distribution of neuronal subtypes among those cells. Top panel: Distribution of neuronal subtypes expressing the key substrate, AGT, and key enzymes for the RAS showing no significant subtype-specific alterations after DOCA-salt treatment. Bottom panel: Significant alterations in the subtype distribution of neurons expressing Atp6ap2 under DOCA-salt conditions, with an increased proportion of vasopressin neurons and decreased proportions of CRH neurons and Lnpep (AT4R)-expressing glutamatergic neurons. Colors represent neuronal subtypes according to the provided legend. Data are presented as means ± SEM (*P < 0.05, **P < 0.01 vs. SHAM; Fisher’s exact test).
Figure 9.
Figure 9.. HFD alters metabolic and behavioral parameters.
Metabolic analysis, performed over a 72-hour period at the end of a 6-week diet regimen in mice fed a HFD (60% calories from fat; n = 5) or CD (n = 5). (A) Cumulative food intake. (B) Cumulative water intake. (C, D) VH2O loss, a proxy for thermoregulatory and respiratory water loss, over a 72-hour period (C) and average water vapor loss for 12/12 hours of dark and light cycles (D). (E) Locomotor activity measured as cumulative distance traveled (ped meters). (F) Body weight. (G) Average sleep percentage over 12/12 hours of dark and light cycles. Data are presented as means ± SEM (**P < 0.01, ***P < 0.001, ****P < 0.0001 vs. CD).
Figure 10.
Figure 10.. HFD alters whole-body energy metabolism and substrate utilization.
Energy expenditure (EE), oxygen consumption (VO2), carbon dioxide production (VCO2), and respiratory exchange ratio (RER) measured in mice fed a CD or HFD for 6 weeks. (A, B) Absolute EE over 72 hours (A) and an average over 12/12 hours of dark and light cycles (B). (C) EE normalized to body weight. (D, E) Absolute VO2 over 72 hours (D) and an average over 12/12 hours of dark and light cycles (E). (F) weight-normalized VO2. (G, H) VCO2 levels over 72 hours (G) and an average over 12/12 hours of dark and light cycles (H). (I) VCO2 normalized to body weight. (J, K) RER over 72 hours (J) and an average over 12/12 hours of dark and light cycles (K). Data are presented as means ± SEM (*P < 0.05, **P < 0.01, ***P < 0.001, ****P < 0.0001 vs. CD).
Figure 11.
Figure 11.. Effects of a HFD on the cellular composition and neuronal subtype distribution in the PVN revealed by snRNA-seq.
(A) tSNE visualizations displaying the clustering of major PVN cell types in CD- and HFD-fed mice. (B) Pie charts indicating significant quantitative shifts in major cell populations under HFD conditions, with significantly decreased proportions of oligodendrocytes and increased proportions of neurons. (C) tSNE visualizations illustrating neuronal subtype distributions between CD and HFD mice. (D) Pie charts demonstrating significant changes in neuronal subtype proportions under HFD, including decreases in GABAergic neurons and increases in glutamatergic neurons and vasopressin neurons. Colors denote cell and neuronal subtypes according to the provided legend. Data are presented as means ± SEM (*P < 0.05, **P < 0.01, ***P < 0.001 for CD vs. HFD; Fisher’s exact test).
Figure 12.
Figure 12.. HFD induces cell-type-specific alterations in RAS gene expression in the PVN.
Pie charts illustrating the distribution of PVN cell types expressing specific RAS genes in CD- versus HFD-fed mice. Numbers in the center of each pie chart indicate total counts of cells expressing each RAS gene, and percentages represent the proportion of each cell type among cells expressing a given gene. Top panel: Proportions of cell types expressing Agt and genes encoding key RAS enzymes, showing no significant shifts under HFD conditions. Bottom panel: Significant increase in the proportion of Lnpep-expressing neurons under HFD, together with slight but significant reductions in Atp6ap2- and Lnpep-expressing microglia. Colors denote specific cell types, as indicated in the provided legend. Data are presented as means ± SEM (*P < 0.05, ***P < 0.001 for CD vs. HFD; Fisher’s exact test).
Figure 13.
Figure 13.. HFD induces neuronal subtype-specific alterations in RAS gene expression in the PVN.
Pie charts illustrating the distribution of neuronal subtypes expressing specific RAS genes in CD- versus HFD-fed mice. Numbers in the center of each pie chart indicate the total counts of neurons expressing the respective RAS gene, and percentages represent the proportion of each neuronal subtype among neurons expressing each gene. Top panel: Subtype-specific expression patterns of Agt and other RAS genes, demonstrating notable reductions in the proportion of GABAergic neurons expressing Agt under HFD conditions. Bottom panel: Significant subtype-specific alterations under HFD, including decreased proportions of GABAergic neurons expressing Atp6ap2, Agtr1b, Lnpep, and Mas1, together with marked increases in vasopressin neuronal populations expressing these genes. Colors correspond to neuronal subtypes indicated in the provided legend. Data are presented as means ± SEM (*P < 0.05, ***P < 0.001 for CD vs. HFD; Fisher’s exact test).

Similar articles

References

    1. Benarroch EE. Paraventricular nucleus, stress response, and cardiovascular disease. Clin Auton Res. 2005;15 (4):254–263. doi: 10.1007/s10286-005-0290-7. - DOI - PubMed
    1. Pan S, Worker CJ, Feng Earley Y. The hypothalamus as a key regulator of glucose homeostasis: emerging roles of the brain renin-angiotensin system. Am J Physiol Cell Physiol. 2023;325 (1):C141–C154. doi: 10.1152/ajpcell.00533.2022. - DOI - PMC - PubMed
    1. Carmichael CY, Wainford RD. Hypothalamic signaling mechanisms in hypertension. Curr Hypertens Rep. 2015;17 (5):39. doi: 10.1007/s11906-015-0550-4. - DOI - PMC - PubMed
    1. Ferguson AV, Latchford KJ, Samson WK. The paraventricular nucleus of the hypothalamus - a potential target for integrative treatment of autonomic dysfunction. Expert Opin Ther Targets. 2008;12 (6):717–727. doi: 10.1517/14728222.12.6.717. - DOI - PMC - PubMed
    1. Savic B, Murphy D, Japundzic-Zigon N. The Paraventricular Nucleus of the Hypothalamus in Control of Blood Pressure and Blood Pressure Variability. Front Physiol. 2022;13:858941. doi: 10.3389/fphys.2022.858941. - DOI - PMC - PubMed

Publication types

LinkOut - more resources