[Preprint]. 2025 Aug 20:2025.08.15.669078.
doi: 10.1101/2025.08.15.669078.

White matter microstructure changes across the lifespan: a meta-analysis of longitudinal diffusion MRI studies

Affiliations

White matter microstructure changes across the lifespan: a meta-analysis of longitudinal diffusion MRI studies

Karis Colyer-Patel et al. bioRxiv. .

Abstract

Background: White matter in the human brain is known to play a critical role in facilitating communication between different brain regions. White matter microstructure is often quantified using fractional anisotropy (FA) derived from diffusion-weighted MRI and is often considered a key measure of neural efficiency that is positively associated with motor and cognitive functioning. While lifespan trajectories of FA have been well studied in cross-sectional designs, it remains less clear how FA changes longitudinally with age across the lifespan, and whether the rates of change are influenced by genetic variation.

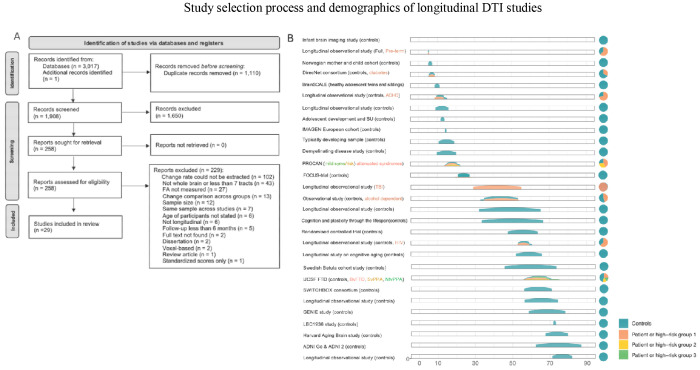
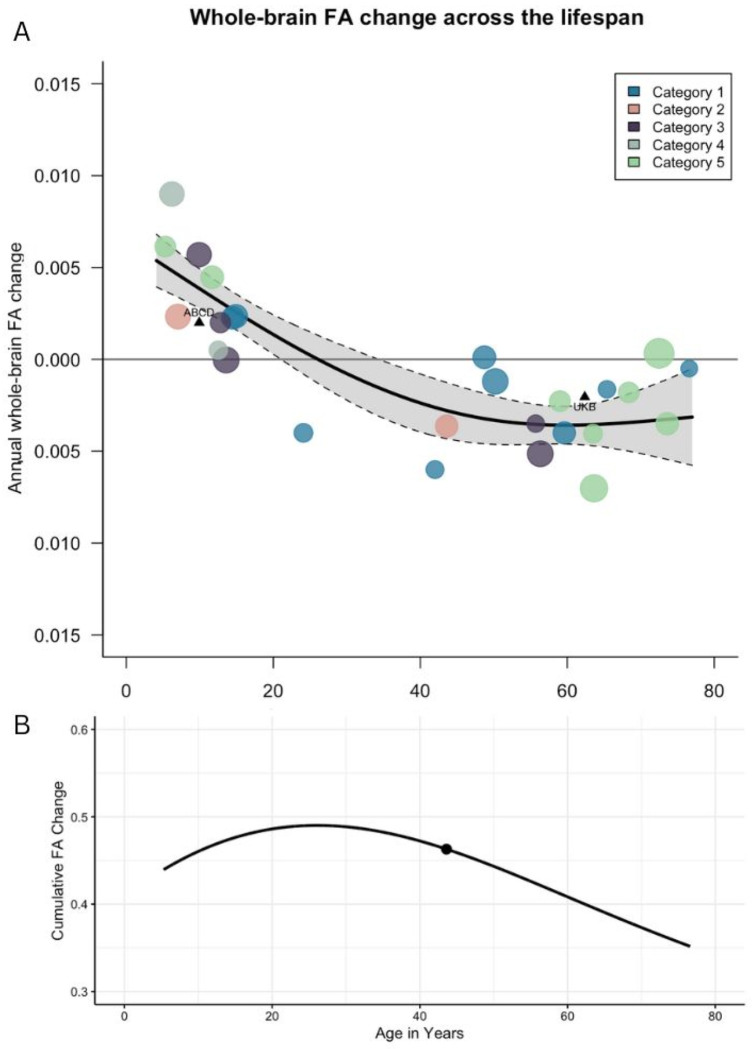
Methods: We systematically reviewed the evidence of white matter changes, as measured by fractional anisotropy (FA) with diffusion magnetic resonance imaging longitudinally across the lifespan, and the genetic influences on this change. Searches were conducted in Medline, PsycInfo, and EMBASE up to August 2023 with terms related to DTI/FA and longitudinal/change. Following this, genetic-related search terms were applied to the results, and the search was broadened to include other measures of white matter change. Our systematic search resulted in 29 studies that met our criteria. In addition, 14 studies investigated genetic influences on FA change rates across the lifespan. A meta-regression using a thin-plate spline model was conducted to examine annual whole-brain FA change as a function of age.

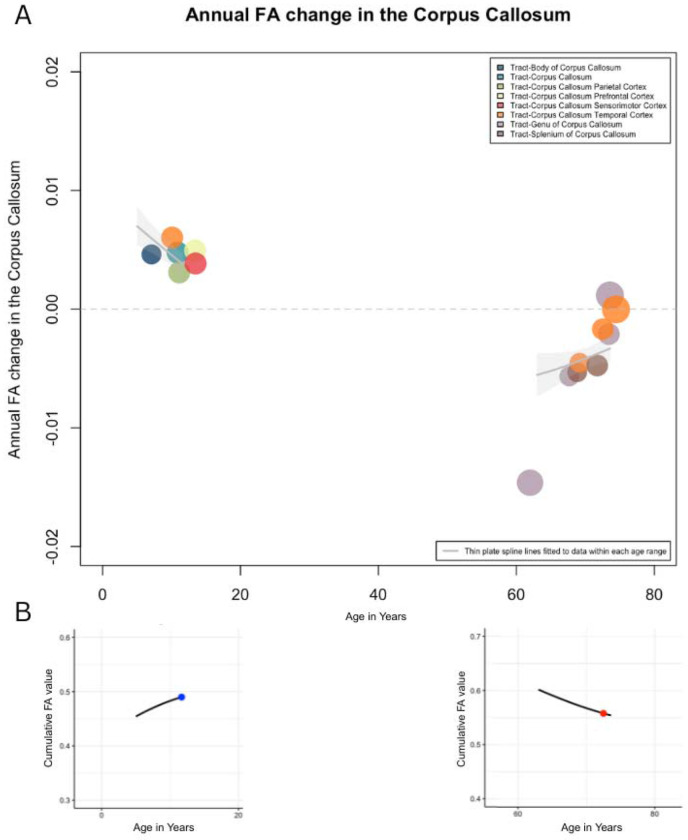
Results: Across childhood and adolescence, FA increased, and the rate of increase slowed into early adulthood. Between ages 20 and 35, changes in FA were not statistically significant. This was followed by a significant decline in FA between ages 36 and 50. The decreases plateaued between ages 51 and 61 and then continued at a slightly slower rate towards the upper end of the age range assessed (77 years). Average FA change per year relative to baseline assessment reached a maximum of +1.1% during development, and -0.6% per year, during ageing. Significant heritability was found for change in local but not global FA during development. During ageing, common variants in genes that have been related to increased risk for neuropsychiatric disorders (APOE, HTT, MAPT) were associated in some studies with accelerated local FA decreases over time.

Conclusions: In conclusion, there are changes in white matter microstructure within individuals across the lifespan, with increases during childhood, adolescence and early adulthood, followed by a period of relative stability during early to mid-adulthood, and subsequent gradual declines from midlife onwards. Evidence is emerging for genetic influences on white matter changes over time, shaping individual trajectories.

Keywords: GWAS; brain; candidate gene; diffusion tensor imaging; fractional anisotropy; genetic; heritability; longitudinal; meta-analysis; network connectivity; systematic review; white matter.


Figures

Figure 1
Figure 1
A. PRISMA flow diagram detailing the screening process for the meta-analysis. B. Overview of demographics of included studies. Per cohort, an age distribution is displayed based on mean and standard deviation of the age at baseline. On the right, the total number of included subjects is displayed and a pie-chart of the distribution of controls/individuals not belonging to a diagnostic group (blue), and cohorts including one (in orange), two (yellow) or three (green) high risk/diagnostic groups . Abbreviations: ADHD Attention Deficit Hyperactivity Disorder, BP Bipolar disorder, BvFTD Behavioural variant frontotemporal dementia, mild syms Mild Symptoms of attenuated syndromes, NfvPPA Non-fluent variant of primary progressive aphasia, risk Familial risk of attenuated syndromes, SU Substance use, SvPPA Semantic variant of primary progressive aphasia, TBI Traumatic Brain Injury, HIV Human Immunodeficiency Virus.
Figure 2.
Figure 2.. Meta-analysis of whole-brain FA change across the lifespan.
Annual FA change per year represents the FA at timepoint 2 minus FA at timepoint 1, divided by the number of years between timepoints. Each circle represents a cohort, with circle size proportional to cohort size (ranging from N = 32 to N = 213). Data were pooled across groups within each study. Studies were classified into four categories: Category 1 reported both point estimates and SD or p-values (blue circles); Category 2 required approximation of the point estimate but reported p-values to estimate SD (green circles); Category 3 reported point estimates but used a conservative p-value to estimate SD (purple circles); Category 4 required approximation of both the point estimate and SD or p-values (grey circles); Category 5 included studies that measured FA change across individual tracts, from which a pooled estimate of annual FA change was calculated. A. A thin-plate spline model was used to fit the data, shown with 95% confidence intervals. B. The estimated trajectory of whole-brain FA values across the lifespan was derived by integrating the predicted annual FA change rates from the spline model using Riemann sum approximation. The trajectory was anchored at age 43 using a reference FA value from Pfefferbaum et al. (2014), which is represented by a black dot to reflect the average age of samples included in the meta-analysis.
Figure 3.
Figure 3.. Meta-analysis of FA change rate in the corpus callosum.
Annual FA change per year represents the FA at timepoint 2 minus FA at timepoint 1, divided by the number of years between timepoints. Each circle represents a cohort; circle size reflects cohort size (ranging from N = 73 to 427 individuals). Colours indicate different subregions of the corpus callosum. Data were pooled across groups within each study that measured the same corpus callosum region. Notably, the included studies include both healthy and clinical populations. Thin plate spline lines were fitted to the data within two distinct age ranges (5-12 years and 63-74 years) and are shown with their corresponding 95% confidence intervals. B. The estimated trajectory of whole-brain FA values across the lifespan was derived by integrating the predicted annual FA change rates from the spline model using Riemann sum approximation. The trajectory during development was anchored at age 11.68 using a reference FA value from Chiang et al., (2023), which is represented by a blue dot. The trajectory during ageing was anchored at age 72.49 using a reference FA value from Alloza et al., (2018), which is represented by a red dot.

Similar articles

References

    1. Acheson A., Wijtenburg S. A., Rowland L. M., Winkler A., Mathias C. W., Hong L. E., … & Dougherty D. M. (2017). Reproducibility of tract based white matter microstructural measures using the ENIGMA DTI protocol. Brain and behavior, 7(2), e00615. - PMC - PubMed
    1. Adrian J., Sawyer C., Bakeman R., Haist F., & Akshoomoff N. (2023). Longitudinal structural and diffusion-weighted neuroimaging of young children born preterm. Pediatric Neurology, 141, 34–41. - PubMed
    1. Alloza C., Cox S. R., Cábez M. B., Redmond P., Whalley H. C., Ritchie S. J., … & Bastin M. E. (2018). Polygenic risk score for schizophrenia and structural brain connectivity in older age: a longitudinal connectome and tractography study. Neuroimage, 183, 884–896. - PMC - PubMed
    1. Amunts K., Mohlberg H., Bludau S., & Zilles K. (2020). Julich-Brain: A 3D probabilistic atlas of the human brain’s cytoarchitecture. Science, 369(6506), 988–992. - PubMed
    1. Alexander A. L., Hurley S. A., Samsonov A. A., Adluru N., Hosseinbor A. P., Mossahebi P., … & Field A. S. (2011). Characterization of cerebral white matter properties using quantitative magnetic resonance imaging stains. Brain connectivity, 1(6), 423–446. - PMC - PubMed

Publication types

LinkOut - more resources