[Preprint]. 2025 Aug 21:2025.08.15.670603.
doi: 10.1101/2025.08.15.670603.

DFFB suppresses interferon to enable cancer persister cell regrowth

Affiliations

DFFB suppresses interferon to enable cancer persister cell regrowth

August F Williams et al. bioRxiv. .

Abstract

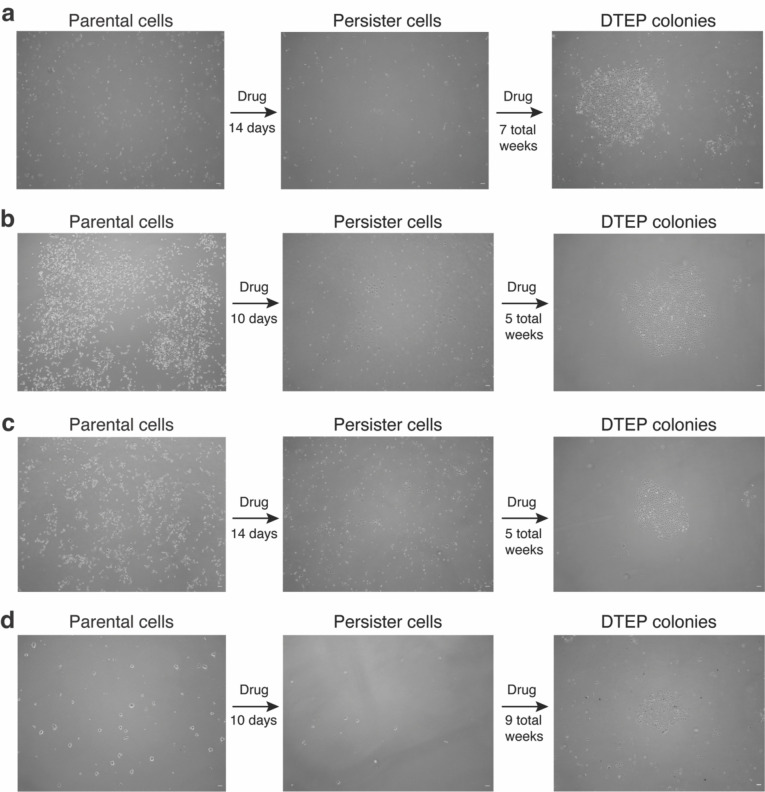
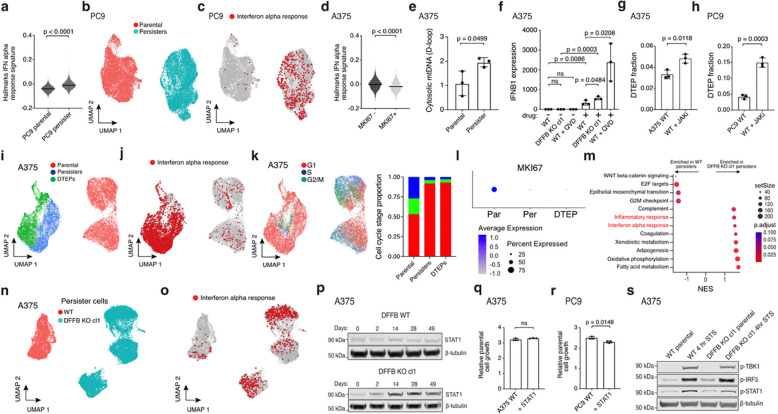
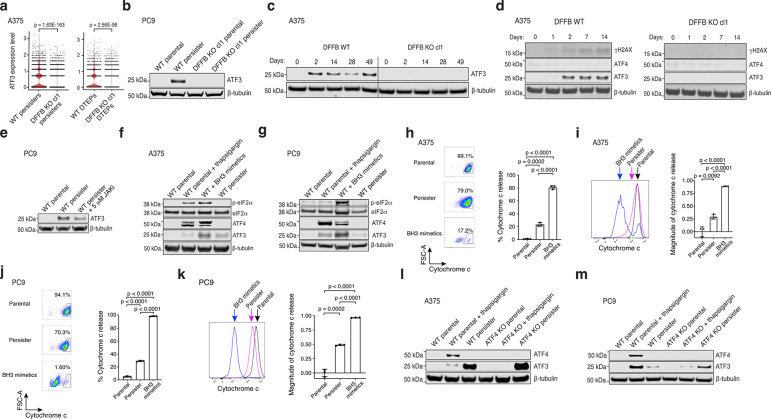
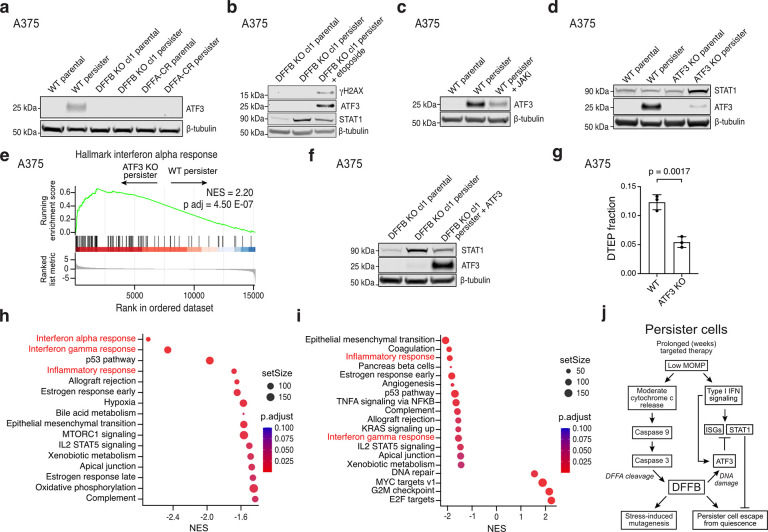
Oncogene targeted cancer therapies can provide deep responses but frequently suffer from acquired resistance.1 Therapeutic approaches to treat tumours which have acquired drug resistance are complicated by continual tumour evolution and multiple co-occurring resistance mechanisms.2,3 Rather than treating resistance after it emerges, it may possible to prevent it by inhibiting the adaptive processes which initiate resistance but these are poorly understood.4 Here we report that residual cancer persister cells that survive oncogene targeted therapy are growth arrested by drug stress-induced intrinsic Type I interferon (IFN) signaling. To escape growth arrest, persister cells leverage apoptotic machinery to transcriptionally suppress interferon-stimulated genes (ISGs). Mechanistically, persister cells sublethally engage apoptotic caspases to activate DNA endonuclease DNA Fragmentation Factor B (DFFB, also known as Caspase-Activated DNase (CAD)) which induces DNA damage, mutagenesis, and stress response factor Activating Transcription Factor 3 (ATF3). ATF3 limits Activator Protein-1 (AP1)-mediated ISG expression sufficiently to allow persister cell regrowth. Persister cells deficient in DFFB or ATF3 exhibit high ISG expression and are consequently unable to regrow. Therefore, sublethal apoptotic stress paradoxically promotes regrowth of residual cancer cells that survive drug treatment.


Conflict of interest statement

Competing interests: M.J.H. is a cofounder, consultant, and research funding recipient of BridgeBio subsidiary Ferro Therapeutics.

Figures

Extended Data Fig. 1:
Extended Data Fig. 1:. Persister cell and DTEP colony formation models.
a, A375 BRAF V600E melanoma cells treated with 250 nM dabrafenib and 25 nM trametinib. b, PC9 EGFR mutant lung adenocarcinoma cells treated with 2.5 μM erlotinib. c, PC9 cells treated with 500 nM osimertinib. d, BT474 HER2+ breast cancer cells treated with 2 μM lapatinib. Time shown to DTEP colony formation includes initial persister cell formation treatment period. Scale bar = 100 μm.
Extended Data Fig. 2:
Extended Data Fig. 2:. Persister cells undergo chronic drug-induced sublethal apoptotic stress that causes DNA damage.
a, Quantification of cleaved caspase 3 from flow cytometry of live-gated cells. b, Relative growth in drug-free media for 6 days of A375 persister cells after sorting for basal or medium (sublethal elevated) caspase 3/7 activity. See Supplementary Fig. 5 for sorting strategy. c, A375 cells treated with 250 nM dabrafenib and 25 nM trametinib for 24 or 48 hours and assessed for cleaved caspase 3 or DNA damage marker γH2AX. d, A375 parental, persister, and DTEP cells derived from 7 weeks of treatment with 250 nM dabrafenib and 25 nM trametinib analyzed for cleaved caspase 3. e-h, Parental and persister cells assessed for γH2AX with and without treatment with 10 μM caspase inhibitor QVD. e, PC9 cells treated with 500 nM osimertinib. f, PC9 cells treated with 2.5 μM erlotinib. g, BT474 cells treated with 500 nM lapatinib. h, A375 parental and persister cells assessed by flow cytometry for γH2AX. i, A375 WT and caspase 9 KO clones analyzed for caspase 9, cleaved caspase 3, cleaved DFFA, and γH2AX. j, A375 persister cells sorted by caspase 3/7 activity levels and assessed for cleaved caspase 3 and γH2AX. k, A375 persister and DTEP cell caspase-dependent cleaved DFFA. 250 nM (c,d,j,k), 500 nM (e,f), or 750 nM (g) staurosporine treatment for 24 hours was used as a positive control. For a,b,h, n = 3 biological replicates, mean ± s.d.; two-tailed Student’s t-test; ns, not significant.
Extended Data Fig. 3:
Extended Data Fig. 3:. CRISPR KO, DNA damage and DTEP formation data.
a-c, DFFB expression in parental and persister cells. a, A375 cells treated with 250 nM dabrafenib and 25 nM trametinib. b, PC9 cells treated with 2.5 μM erlotinib. c, BT474 cells treated with 500 nM lapatinib. d-f, DFFB loss of expression in CRISPR KO clones. cl, clone. d, A375 DFFB KO clones. e, PC9 DFFB KO clones. WT cl1 is a control WT clone which failed to lose DFFB expression during CRISPR editing. f, BT474 DFFB KO clones. g, Caspase 9 expression in CRISPR-mediated caspase 9-depleted (pooled KO) A375 cells used in Fig. 3f. h, PC9 cells treated with 2.5 μM erlotinib were assessed for DNA damage marker γH2AX. Parental cells were treated for 24 hours with 500 nM staurosporine as a positive control. i, PC9 cells treated with 2.5 μM erlotinib for 5 weeks were analyzed for DTEP formation. n = 3 biological replicates, mean ± s.d.; two-tailed Student’s t-test.
Extended Data Fig. 4:
Extended Data Fig. 4:. DFFB deficiency does not correlate with clonal variability in tumour cell proliferation or initial drug response.
a-b, A375 DFFB KO cells form tumours and respond to drug in vivo similarly to WT cells. cl, clone. a, A375 xenograft tumour formation and b, initial drug response to dabrafenib and trametinib in mice. n = 6 biological replicates; mean ± s.d. is shown; P values calculated with two-tailed Student’s t-test; ns, not significant. c-f, Clonal variability in parental cell growth rates in cell culture is independent of DFFB WT or loss of function (LOF) status. DFFA-CR, cleavage resistant DFFA. g-k, WT and DFFB LOF cell initial 3 day drug treatment response. g,k, A375 cells treated with 250 nM dabrafenib and 25 nM trametinib. h, PC9 cells treated with 2.5 μM erlotinib. i, PC9 cells treated with 500 nM osimertinib. j, BT474 cells treated with 2 μM lapatinib. l-p, WT and DFFB LOF persister cell formation. l,p, A375 cells treated with dabrafenib and trametinib. m, PC9 cells treated with erlotinib. n, PC9 cells treated with osimertinib. o, BT474 cells treated with lapatinib. For c-p, n = 3 biological replicates; mean ± s.d. is shown; P values calculated with two-tailed Student’s t-test. ns, not significant. q, Cleaved caspase 3 analyzed in A375 WT and DFFB KO parental and persister cells. r, DFFB essentiality in CRISPR screen data from the PICKLES database. Negative scores reflect non-essentiality.
Extended Data Fig. 5:
Extended Data Fig. 5:. Stress-induced mutagenesis-associated transcriptional patterns.
a-e, Comparison gene expression changes associated with stress-induced mutagenesis including downregulated repair genes, downregulated high fidelity polymerases, and upregulated error prone polymerases, in persister versus parental cells. a-d, A375 persister cells derived from 250 nM dabrafenib and 25 nM trametinib. a,b, A375 WT cells analyzed with (a) scRNAseq and (b) bulk RNAseq. c,d, A375 DFFB KO cells analyzed with (c) scRNAseq and (d) bulk RNAseq. cl, clone. e, PC9 persister cells treated with 2.5 μM erlotinib and analyzed with scRNAseq. Mismatch repair (MMR); homology-directed repair (HR).
Extended Data Fig. 6.
Extended Data Fig. 6.. Increased STAT1 and ISGs restrict persister cell regrowth.
a, ScRNAseq Hallmarks interferon alpha response gene set signature scores in PC9 cells. P values calculated with Mann-Whitney test. b-c, ScRNAseq UMAP visualizations of PC9 parental cells and persister cells derived from 2.5 μM erlotinib for 14 days (b) and cells with enriched Hallmarks interferon alpha response gene set highlighted in red (c). d, Hallmarks interferon alpha response gene set signature scores in A375 cycling (MKI67+) versus noncycling (MKI67−) DTEP cells. P value calculated with Mann-Whitney test. e, A375 cells analyzed for cytosolic mitochondrial DNA. f, IFNB1 mRNA expression in A375 cells treated with 1 μM dabrafenib and 100 nM trametinib for 6 days with and without 10 μM caspase inhibitor QVD treatment. cl, clone. g, DTEP formation from A375 WT persister cells treated with 250 nM dabrafenib and 25 nM trametinib for 2 weeks followed by the addition of 1 μM JAK inhibitor ruxolitinib for 5 weeks. h, DTEP formation from PC9 persister cells co-treated with 300 nM osimertinib and 5 μM ruxolitinib for 5 weeks. i-k, ScRNAseq UMAP visualizations of A375 parental cells, persister cells derived from treatment with 250 nM dabrafenib and 25 nM trametinib for 14 days, and DTEP cells treated for 9 weeks (i), cells with enriched Hallmarks interferon alpha response gene set highlighted in red (j), and cells colored by cell cycle stage (k). l, ScRNAseq MKI67 (Ki-67) expression in A375 parental (Par), persister (Per), and DTEP cells. m, Bulk RNAseq enriched Hallmarks gene sets between A375 DFFB KO versus WT persister cells. Normalized enrichment score, NES. n-o, scRNAseq UMAPs of A375 WT and DFFB KO persister cells (n) and cells with enriched Hallmarks interferon alpha response gene set highlighted in red (o). p, A375 cells treated with 250 nM dabrafenib and 25 nM trametinib and assessed for STAT1 at multiple timepoints. q-r, A375 (q) and PC9 (r) parental cell proliferation with or without overexpressed STAT1. s, A375 cells treated with 1 μM staurosporine (STS) for 4 hours analyzed for activation of IFN signaling upstream of ISG expression. e-h,q-r, n = 3 biological replicates; mean ± s.d. is shown; P values calculated with two-tailed Student’s t-test. ns, not significant.
Extended Data Fig. 7.
Extended Data Fig. 7.. ATF3 is induced in persister cells independent of the integrated stress response.
a, ATF3 expression levels between A375 WT and DFFB KO persister and DTEP cells measured with scRNAseq. P values calculated with the Wilcoxon Rank Sum test with Bonferroni correction. cl, clone. b, ATF3 expression in PC9 WT and DFFB KO cells treated with 500 nM osimertinib. c, A375 WT and DFFB KO cells treated with 250 nM dabrafenib and 25 nM trametinib analyzed for ATF3 at the indicated times. d, A375 WT and DFFB KO cells treated with 250 nM dabrafenib and 25 nM trametinib analyzed for γH2AX, ATF4, and ATF3 at the indicated times. e, PC9 persister cells derived from 500 nM osimertinib with or without 5 μM JAK inhibitor ruxolitinib and analyzed for ATF3 levels. f, A375 WT cells treated with ER stress inducer 1 μM thapsigargin for 4 hours, BH3 mimetics 5 μM ABT-737 and 10 μM S63845 for 2.5 hours followed by 24 hour recovery, and persister cells analyzed for ISR genes (phosphorylated (p) eIF2α, total eIF2α, ATF4) and ATF3. g, PC9 WT cells treated with 1 μM thapsigargin, BH3 mimetics 1.5 μM ABT-737 and 3 μM S63845 for 4 hours followed by 2 hour recovery, and persister cells analyzed for ISR genes and ATF3. h-k, Flow cytometry analysis of cytochrome C release in A375 (h,i) and PC9 (j,k) parental, persister, and BH3 mimetic-treated cells. i and k, Fractional loss of cytochrome C (geometric means) are plotted on the right graphs. n = 3 biological replicates; mean ± s.d. is shown; P values calculated with two-tailed Student’s t-test. l,m, A375 (l) and PC9 (m) WT and ATF4 CRISPR-depleted (pooled KO) persister cells were analyzed for ATF3 levels. For thapsigargin-induced ISR, ATF3 expression is decreased in ATF4-depleted cells. In persister cells (which lack the ISR) ATF3 is expressed despite ATF4-depletion.
Extended Data Fig. 8.
Extended Data Fig. 8.. Additional ATF3 and AP1 data.
a,b, A375 ATF3-depleted (pooled KO) cells assessed for parental cell proliferation (a) and persister cell formation (b). c, A375 WT DTEP cycling (MKI67+) and noncycling (MKI67−) cell ATF3 scRNAseq expression. P values calculated with the Wilcoxon Rank Sum test. d, STRING analysis of ATF3 interactions. e, Bulk RNAseq gene set enrichment analysis of A375 WT persister cells versus persister cells co-treated with 20 μM AP1 inhibitor T-5224. n = 3 biological replicates. a,b, n = 3 biological replicates; mean ± s.d. is shown; P values calculated with two-tailed Student’s t-test. ns, not significant.
Extended Data Fig. 9.
Extended Data Fig. 9.. Comparison of persister and DTEP cell signatures with targeted therapy-treated patient tumours.
a,b, ScRNAseq anastasis gene set signature scores in A375 parental, persister, and DTEP timepoint DFFB WT and KO cells (a) and PC9 parental and persister cells (b). P values calculated with Mann-Whitney test. Anastasis remains elevated at the DTEP timepoint, indicating that DTEP cells remain drug stressed. cl, clone. c, Anastasis gene set expression analyzed in on-treatment versus pretreatment patient melanoma tumours treated with BRAF +/− MEK targeted therapy. Normalized enrichment score, NES. P value calculated with a permutation test with family-wise error rate correction. d, Anastasis gene set signature scores in treatment naïve (TN), residual disease (RD), and progressive disease (PD) patient non-small cell lung cancer tumours treated with EGFR targeted therapy. e, MKI67 (Ki-67) expression in pretreatment and on-treatment melanoma patient tumours. f, Ki-67 expression in each lung cancer treatment response stage. g-h, Hallmarks interferon alpha response gene set expression analyzed in on-treatment versus pretreatment patient melanoma (g) and lung cancer tumour treatment response stages (h). i, ATF3 expression in pretreatment and on-treatment patient melanoma tumours. j, ATF3 expression in each lung cancer treatment response stage. P value calculated with the Wilcoxon Rank Sum test with Bonferroni correction. k,l, A375 (k) and PC9 (l) WT and DFFB KO parental and persister cells analyzed for STING expression. a,b,d,h, P values calculated with Mann-Whitney test. e,i, n = 11 patients. P values calculated with paired ratio t-test.
Fig. 1.
Fig. 1.. Drug-tolerant persister cells undergo chronic sublethal apoptotic stress-induced DNA damage.
a, Microscopy of A375 persister and DTEP cells treated with 250 nM dabrafenib and 25 nM trametinib. b, Bulk RNAseq gene set enrichment analysis of the anastasis signature in A375 persister cells. Normalized enrichment score, NES. P value calculated with a permutation test with family-wise error rate correction. c-f, ScRNAseq UMAPs of A375 (c,d) and PC9 (e,f) parental cells and persister cells. UMAP, uniform manifold approximation and projection. d,f, Cells with enriched anastasis gene set are highlighted in red. g, A375 parental and persister cells assessed for mitochondrial release of cytosolic cytochrome c. h, A375 parental and persister cells assessed for loss of mitochondrial (MT) potential using JC-1 indicator dye by flow cytometry. i, A375 persister cells assessed for cleaved caspase 3 and γH2AX either on drug or following 24 or 72 hours of drug removal. j, Flow cytometry quantification of caspase 3/7 activity reporter geometric means. k, A375 persister cells sorted for basal, medium (sublethal), and high (lethal) caspase 3/7 activity, replated in media without drug, and assessed for cell viability the following day. l, Parental and persister cells assessed for γH2AX with or without co-treatment with 10 μM caspase inhibitor QVD. i,j,l, Parental cells treated for 24 hours with 250 nM (i,l) or 4 hours with 1 μM staurosporine (j) were used as a positive control. g,h,j,k n = 3 biological replicates; mean ± s.d. is shown; P values calculated with two-tailed Student’s t-test unless stated otherwise.
Fig. 2.
Fig. 2.. Apoptotic DNase DFFB mediates persister cell DNA damage, mutagenesis and regrowth.
a, A375 persister cells exhibit cleaved DFFA indicating DFFB activation. b-e, Persister cell DNA damage is absent in A375 (b,e), PC9 (c), and BT474 (d) DFFB loss of function (LOF) persister cells. a-e, 250 nM (a,b,e), 500 nM (c), or 750 nM (d) staurosporine treatment for 24 hours was used as a positive control. cl, clone. DFFA-CR, ectopically expressed DFFA cleavage resistant variant. f, Doxycycline-inducible re-expression of nuclease active DFFB, but not nuclease dead DFFB, in DFFB KO A375 persister cells restores drug-induced DNA damage. g-k, Measurement of fraction of cells which regrow into DTEP colonies during treatment. n = 3 biological replicates; mean ± s.d.; two-tailed Student’s t-test. gbj,k, A375 melanoma cells treated with dabrafenib and trametinib. h, PC9 lung cancer cells treated with osimertinib. i, BT474 breast cancer cells treated with lapatinib. l, Tumour volume of A375 xenograft tumours in mice treated with dabrafenib and trametinib. Data are normalized to the minimum volume of each tumour during treatment; n = 3 biological replicates; mean ± s.d.; two-tailed Student’s t-test. m,n, Whole exome sequencing analysis of mutations acquired by A375 cells during 7 weeks of dabrafenib and trametinib treatment (m) and PC9 cells during 10 weeks of 2.5 μM erlotinib treatment (n). m, n = 8 WT biological replicates and 9 DFFB KO biological replicates. n, n = 7 WT and 7 DFFB KO biological replicates. m,n, Mean ± s.d.; two-tailed Student’s t-test.
Fig. 3.
Fig. 3.. DFFB suppresses interferon signaling to allow persister cell regrowth.
a, ScRNAseq Hallmarks IFN alpha response gene set signature scores in A375 DFFB WT and KO parental cells and drug treated cells at the persister and DTEP timepoints. P values calculated with Mann-Whitney test. cl, clone. b-c, ScRNAseq UMAP of similar numbers of A375 WT and DFFB KO cells at 9 weeks of drug treatment (b) with enriched Hallmarks interferon alpha response gene set highlighted in red (c). d,e, Measurement of fraction of cells which regrew into DTEP colonies during treatment. d, A375 DFFB KO cells treated with 250 nM dabrafenib and 25 nM trametinib for 2 weeks to derive persister cells, then 1 μM JAK inhibitor ruxolitinib was added and all three drugs were maintained for 5 more weeks. e, PC9 DFFB KO cells treated with 300 nM osimertinib and 5 μM ruxolitinib for 5 weeks. f, Total STAT1 levels in A375 persister cells co-treated for 14 days with 1 μM TBK1 inhibitor MRT67307 or 1 μM JAK inhibitor. g, A375 caspase 9-depleted (pooled KO) and cleavage resistant DFFA (DFFA-CR)-expressing parental and persister cells analyzed for STAT1. h, PC9 WT and DFFB KO persister cells treated with 500 nM osimertinib analyzed for STAT1. i, A375 DFFB KO cells treated for 7 days with 250 nM dabrafenib and 25 nM trametinib with and without 1.5 μM of interferon alpha receptor 1 neutralizing antibody (IFNAR1-nAb) and analyzed for total STAT1 expression. j,k, A375 WT and STAT1 overexpressing cells treated with 250 nM dabrafenib and 25 nM trametinib and analyzed for DTEP colony formation. l,m, PC9 WT and STAT1 overexpressing cells treated with 300 nM osimertinib and analyzed for DTEP colony formation. d,e,k,m, n = 3 biological replicates; mean ± s.d. is shown; P values calculated with two-tailed Student’s t-test.
Fig. 4.
Fig. 4.. DFFB induces ATF3 to suppress ISGs and enable persister cell regrowth.
a, ATF3 protein levels in A375 WT, DFFB KO, and DFFA-CR parental and persister cells. cl, clone. b, A375 DFFB KO persister cells treated with or without 100 μM etoposide for 48 hours and analyzed for DNA damage, ATF3 and STAT1. c, A375 WT persister cells co-treated with 1 μM JAKi and analyzed for ATF3 expression. d, Total STAT1 and ATF3 levels in A375 cells with CRISPR-mediated ATF3 depletion (pooled KO). e, Bulk RNAseq gene set enrichment analysis of Hallmarks interferon alpha response gene set using differentially expressed genes between A375 ATF3 KO and WT persister cells. Normalized enrichment score, NES. f, Total STAT1 and ATF3 protein levels in A375 DFFB KO persister cells with ectopically expressed ATF3. g, DTEP colony formation in A375 WT and ATF3-depleted (pooled KO) cells. n = 3 biological replicates; mean ± s.d.; two-tailed Student’s t-test. h-i, Bulk RNAseq gene set enrichment analysis of A375 ATF3 KO (h) and DFFB KO (i) persister cells with versus without co-treatment with 20 μM AP1 inhibitor T-5224. Interferon-related gene sets are colored red. n = 3 biological replicates. j, Summary diagram.

References

    1. Dagogo-Jack I. & Shaw A. T. Tumour heterogeneity and resistance to cancer therapies. Nat. Rev. Clin. Oncol. 15, 81–94 (2018). - PubMed
    1. Romano E. et al. Identification of Multiple Mechanisms of Resistance to Vemurafenib in a Patient with BRAFV600E-Mutated Cutaneous Melanoma Successfully Rechallenged after Progression. Clin. Cancer Res. 19, 5749–5757 (2013). - PubMed
    1. Juric D. et al. Convergent loss of PTEN leads to clinical resistance to a PI(3)Kα inhibitor. Nature 518, 240–244 (2015). - PMC - PubMed
    1. Mullard A. Stemming the tide of drug resistance in cancer. Nat. Rev. Drug Discov. 19, 221–223 (2020). - PubMed
    1. Hata A. N. et al. Tumor cells can follow distinct evolutionary paths to become resistant to epidermal growth factor receptor inhibition. Nat. Med. 22, 262–269 (2016). - PMC - PubMed

Methods References:

    1. Zheng G. X. Y. et al. Massively parallel digital transcriptional profiling of single cells. Nat. Commun. 8, 14049 (2017). - PMC - PubMed
    1. Satija R., Farrell J. A., Gennert D., Schier A. F. & Regev A. Spatial reconstruction of single-cell gene expression data. Nat. Biotechnol. 33, 495–502 (2015). - PMC - PubMed
    1. Butler A., Hoffman P., Smibert P., Papalexi E. & Satija R. Integrating single-cell transcriptomic data across different conditions, technologies, and species. Nat. Biotechnol. 36, 411–420 (2018). - PMC - PubMed
    1. Stuart T. et al. Comprehensive Integration of Single-Cell Data. Cell 177, 1888–1902.e21 (2019). - PMC - PubMed
    1. Kowalczyk M. S. et al. Single-cell RNA-seq reveals changes in cell cycle and differentiation programs upon aging of hematopoietic stem cells. Genome Res. 25, 1860–1872 (2015). - PMC - PubMed

Publication types