. 2025 Aug 7;28(9):113280.
doi: 10.1016/j.isci.2025.113280. eCollection 2025 Sep 19.

Identification of superior rice donors with enhanced nitrogen use efficiency using a comprehensive multivariate genotype selection strategy

Affiliations

Identification of superior rice donors with enhanced nitrogen use efficiency using a comprehensive multivariate genotype selection strategy

Nguyen Trung Duc et al. iScience. .

Abstract

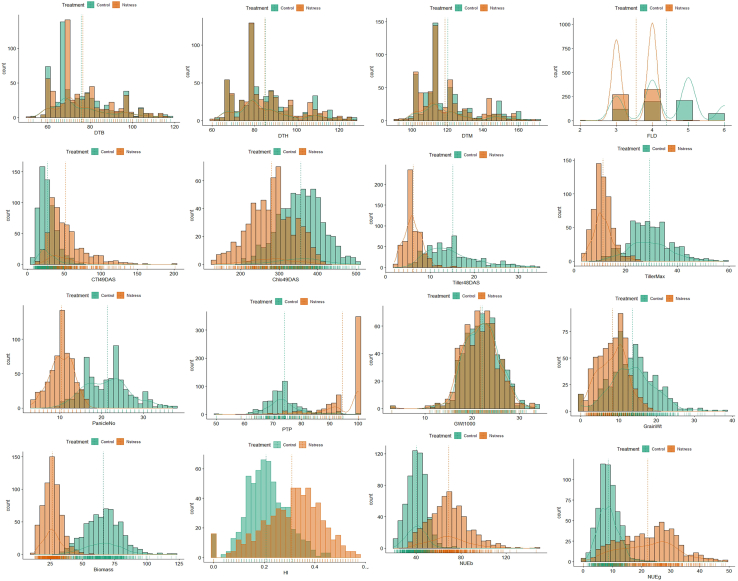
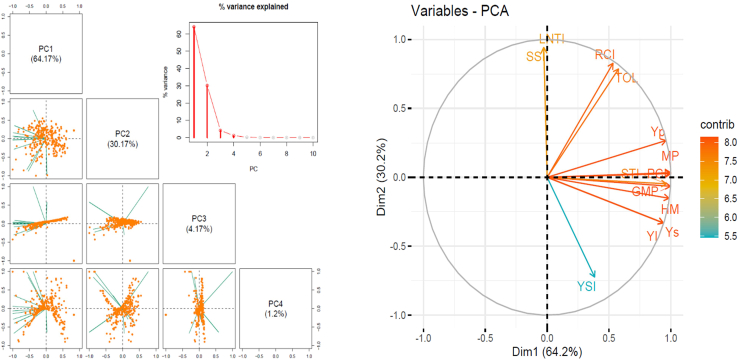
Improving nitrogen use efficiency (NUE) of rice plants utilizing a few end-of-season traits poses a severe phenotyping bottleneck in exploring the genetic diversity of a large population and genotype selection accuracy. Therefore, a comprehensive multivariate genotype selection strategy was developed to explore maximum genetic variation of 300 diverse rice genotypes and accurately select promising rice donors with enhanced NUE traits on a multi-year (2019, 2021, and 2022) -trait (126 traits) -environment (2) -temporal (5) -location (3) scale. The multi-trait genotype ideotype distance index (MGIDI) ranked Cauvery, Suweon, RPW9-4 (SSI) and BAM3690 (IC463705) as superior NUE genotypes; Moroberekan, PUSA1121 and BAM8315 (Basmati 370) as low NUE genotypes. The multi-location field performance and molecular analysis of key nitrogen assimilatory genes confirmed the outperformance of the Cauvery genotype in terms of possessing efficient N sensing, uptake, transport and assimilation characteristics under N-limited conditions. Phenome-wide multivariate analysis highlights root-shoot plastic response as a key target trait for breeding rice genotypes resilient to N stress conditions.

Keywords: Agricultural science; Genomic library; Genotyping; Natural sciences; Plant biology.


Conflict of interest statement

The authors declare no competing interests.

Figures

None
Graphical abstract
Figure 1
Figure 1
Histogram frequency distribution of sixteen growth performance-related traits associated with 300 diverse rice genotypes Green bars represent the Control group. Orange bars represent the N stress group. The x axis denotes the trait metric, while the y axis indicates the frequency (count = 300) of observations. Vertical dashed lines mark the mean values of the trait for each group: Green dashed line for the Control group, Orange dashed line for the N stress group. The small bar lines below the x axis in the histogram are rug plots, which represent individual data points for each treatment group—Control and N stress. These lines provide a visual cue about the density, spread of the data, showing the raw data distribution in a compact form.
Figure 2
Figure 2
Principal component analysis, scree plot and biplot of 11 stress indexes calculated using 300 diverse rice genotypes (A) Scatterplots visualize the distribution of sample values in the reduced-dimensional spaces, highlighting clusters and separation patterns based on the principal components of stress indexes. The percentage of total phenotypic variance explained by the first four PCs is 99.17. (B) Scree plot (right panel) showed the % of phenotypic variance explained by the first ten principal components. A sharp decline (angled elbow) in variance after PC2 indicates that the first two components capture most of the data’s variability and the presence of three major clusters within the studied population group. (C) Biplot showed the first two dimensions represent the first (64.2%) and second (30.2%) principal components, capturing most of the variance in the dataset. Arrows represent individual variables, with their direction indicating the correlation with the principal components and their length reflecting the strength of the contribution. The color gradient (ranging from 5.5 to 8.0) indicates the magnitude of each variable’s contribution, with warmer colors (e.g., red) signifying higher contributions.
Figure 3
Figure 3
Pairs panel on Pearson correlation coefficient matrix of 11 stress indices and grain yield at p ≤ 0.05 (∗), p ≤ 0.01 (∗∗), and p ≤ 0.001 (∗∗∗) significance level The figure represents a correlation matrix visualizing pairwise relationships among multiple variables related to yield and stress indices. Diagonal cells display histograms representing the distribution of individual variables. Lower triangle cells contain scatterplots showing the bivariate relationships between variable pairs. Upper triangle cells display the Pearson correlation coefficients (Corr) quantifying the strength and direction of linear relationships between variables.
Figure 4
Figure 4
Multi-trait genotype ideotype distance index (MGIDI) radar plot (A and B) MGIDI plot based on 16 NUE-related traits in control (A) and N stress (B) treatment. Radar plots visualize the relative performance of genotypes across multiple traits in relation to the ideotype. Selected genotypes are shown in red color. Gray circles represent non-selected genotypes. The red color circle represents selected genotypes with the lowest MGIDI values, indicating closer proximity to the ideotype based on 15% selection pressure.
Figure 5
Figure 5
Hierarchical clustering of 15 promising rice genotypes in N stress treatment A dendrogram represents the clustering of 15 genotypes based on their similarity across multiple traits, useful for selection and breeding decisions. The vertical axis indicates the dissimilarity between clusters, with values ranging from 10 to 22. Two major branches found in the tree represent genotypes grouped based on their similarity, with shorter branch lengths indicating higher similarity.
Figure 6
Figure 6
Heatmap on N stress-induced reduction (%) of key N assimilatory enzyme activity in the selected four rice genotypes contrasting for NUE traits Heatmap illustrates the % reduction in enzymatic activity of five nitrogen metabolism (NR, NiR, GS, GOGAT, and GDH) across different time points and genotypes. Row represents gene expression at specific time points (30, 60 DAT & Flag leaves). The column represents four rice genotypes with contrasting NUE traits. The color gradient indicates % reduction, blue-low expression and Red-high expression.
Figure 7
Figure 7
Heatmap on N stress-induced fold change in gene expression of key N assimilatory genes in the selected four rice genotypes contrasting for NUE trait Heatmap illustrates gene expression levels of five nitrogen metabolism-related genes (OsNLP4, OsNRT1.1b, OsGS1.1, OsNADHGOGAT1) across different time points and genotypes. Row represents gene expression at specific time points (30, 60 DAT & Flag leaves). The column represents four rice genotypes with contrasting NUE traits. The color gradient represents expression intensity, Purple-low expression and Yellow-high expression.
Figure 8
Figure 8
AMMI biplot showing the mean yield performance of fifteen rice genotypes in three locations AMMI biplot (Additive Main effects and Multiplicative Interaction model) illustrates the interaction between genotypes and environments based on two principal components, PC1 (56.9%) and PC2 (43.1%) represent the first two interaction principal component axes (IPCA), together explaining 100% of the genotype × environment interaction variance. Green points and lines represent environments (E1, E2, E3). Blue points and dashed lines represent genotypes (G1 to G14). The proximity of genotypes to environments indicates their specific adaptability, while genotypes near the origin are considered more stable across environments.
Figure 9
Figure 9
Nominal yield plot showing the genotype-environment interaction (GEI) of 15 rice genotypes in three multi-location trials Nominal yield plot illustrates the performance of 15 genotypes (G1 to G15) across a range of environmental conditions, identifying genotypes with high yield potential and stability under varying environmental conditions. The x axis represents the environmental principal component 1 (PC1), expressed as the square root of yield in Mg/ha, indicating environmental quality or productivity. The y axis shows the Nominal Yield (Mg/ha) for each genotype. Each line corresponds to a specific genotype (G1–G15), distinguished by unique colors and line patterns. The slope of each line reflects the sensitivity or responsiveness of the genotype to environmental variation. Steeper slopes suggest higher responsiveness across the environment. Flatter slopes indicate greater stability across environments.
Figure 10
Figure 10
GGE biplot showing the relationship between environment and yield performance of 15 rice genotypes in three locations GGE biplot in the “Which-won-where” view is used to visualize the performance of genotypes across multiple environments, identify mega-environments and the best-performing genotypes within each, supporting genotype selection and recommendation. The x axis (PC1: 65.5%) and y axis (PC2: 22.81%) represent the first two principal components derived from genotype and genotype × environment interaction effects. Points labeled G1 to G16 represent different genotypes. Points labeled E1 to E3 represent different environments. Polygons connect the outermost genotypes, forming sectors that help identify which genotype performed best in which environment. Dotted lines (rays) divide the plot into sectors, each associated with a specific environment. The genotype at the vertex of each sector is considered the “winner” in that environment.

References

    1. FAOSAT . FAO Statistical Database; 2022. Food and Agricultural Organization of the United Nation.https://www.fao.org/faostat/en/#data/QCL
    1. Hickey L.T., N Hafeez A., Robinson H., Jackson S.A., Leal-Bertioli S.C.M., Tester M., Gao C., Godwin I.D., Hayes B.J., Wulff B.B.H., Wulff B.B.H. Breeding crops to feed 10 billion. Nat. Biotechnol. 2019;37:744–754. doi: 10.1038/s41587-019-0152-9. - DOI - PubMed
    1. Elangovan A., Duc N.T., Raju D., Kumar S., Singh B., Vishwakarma C., Gopala Krishnan S., Ellur R.K., Dalal M., Swain P., et al. Imaging sensor-based high-throughput measurement of biomass using machine learning models in rice. Agriculture. 2023;13:852.
    1. Nolan B.T., Hitt K.J. Vulnerability of Shallow Groundwater and Drinking-Water Wells to Nitrate in the United States. Environ. Sci. Technol. 2006;40:7834–7840. doi: 10.1021/es060911u. - DOI - PubMed
    1. Good A.G., Beatty P.H. Fertilizing Nature: A Tragedy of Excess in the Commons. PLoS Biol. 2011;9 doi: 10.1371/journal.pbio.1001124. - DOI - PMC - PubMed

LinkOut - more resources