

Linking Tree and Shrub Biomass to Plant Diversity During Early-Stage Alpine Afforestation
- PMID: 40896100
- PMCID: PMC12391032
- DOI: 10.1002/ece3.71842
Linking Tree and Shrub Biomass to Plant Diversity During Early-Stage Alpine Afforestation
Abstract
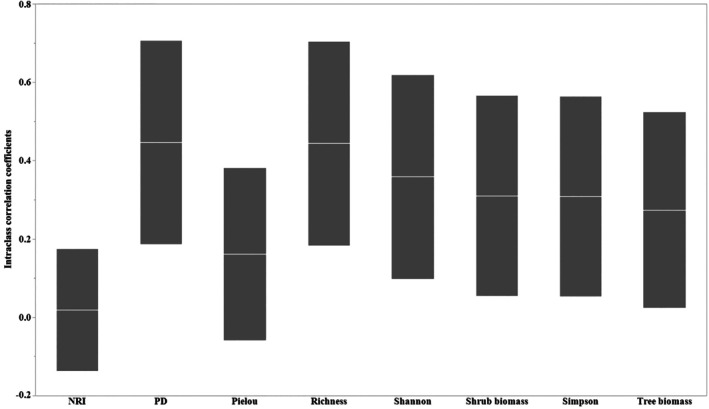
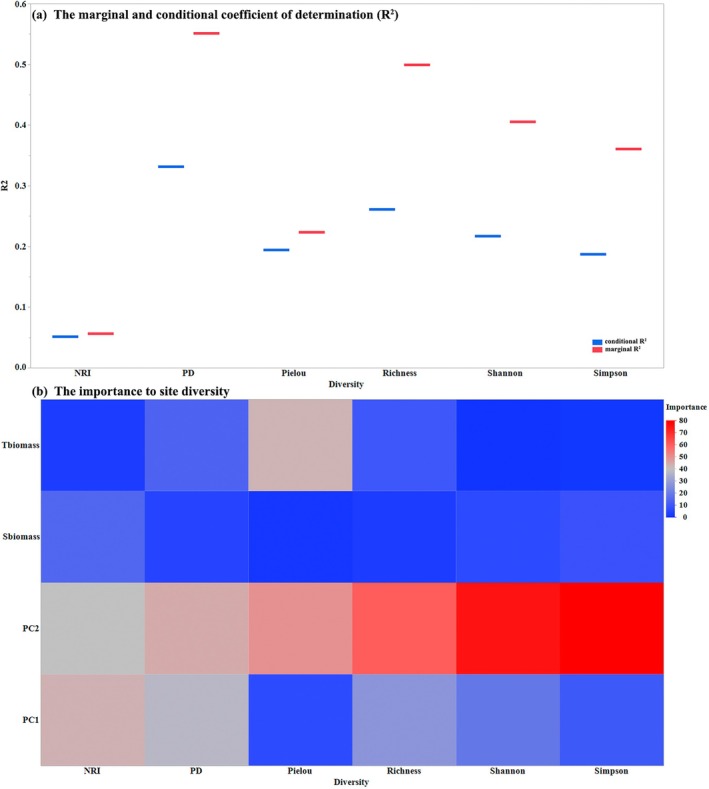
Afforestation has considerable potential to restore and maintain plant diversity, which is closely associated with ecosystem functions and services. However, there remain numerous uncertainties regarding alpine afforestation performance. Hence, it is necessary to determine the factors contributing to plant diversity during the early stages of afforestation in alpine regions. Our main objective of this study was to examine the effects of tree and shrub biomass on plant diversity, namely, species (SD) and phylogenetic (PD) diversity, during the early period of afforestation. We used a general linear mixed model (GLMM) to determine the associations between tree and shrub biomass and multiple indices (Shannon, Simpson's diversity, species richness, Pielou's evenness, Faith's phylogenetic diversity, and net relatedness) at two spatial scales (1 × 1 m2 and 10 × 10 m2), based on 78 10 × 10 m2 sites, each containing five 1 × 1 m2 plots. On the basis of the GLMM results, we established that both tree and shrub biomass had significant effects on plant diversity at the site and plot scales, and found that the responses of SD and PD to tree and shrub biomass were non-linear. Overall, whereas at the site scale, SD (i.e., Pielou's evenness index) was highest at a median level of tree biomass, there were negative relationships between shrub biomass and the Shannon index, species richness, and Faith's PD at the plot scale. The effects of biomass on SD and PD were found to be dependent on different spatial scales (i.e., plot and site) and life form (i.e., tree or shrub), thereby providing further evidence regarding the efficacy of ecological restoration subsequent to alpine afforestation. The findings of this study will provide a novel empirical reference for optimal tree species selection and planning for planting practices in alpine regions.
Keywords: aboveground biomass; afforestation; alpine ecosystem; general linear mixed model; phylogenetic diversity; species diversity.
© 2025 The Author(s). Ecology and Evolution published by British Ecological Society and John Wiley & Sons Ltd.
Conflict of interest statement
The authors declare no conflicts of interest.
Figures


Similar articles
-
Prescription of Controlled Substances: Benefits and Risks.2025 Jul 6. In: StatPearls [Internet]. Treasure Island (FL): StatPearls Publishing; 2025 Jan–. 2025 Jul 6. In: StatPearls [Internet]. Treasure Island (FL): StatPearls Publishing; 2025 Jan–. PMID: 30726003 Free Books & Documents.
-
Systemic pharmacological treatments for chronic plaque psoriasis: a network meta-analysis.Cochrane Database Syst Rev. 2017 Dec 22;12(12):CD011535. doi: 10.1002/14651858.CD011535.pub2. Cochrane Database Syst Rev. 2017. Update in: Cochrane Database Syst Rev. 2020 Jan 9;1:CD011535. doi: 10.1002/14651858.CD011535.pub3. PMID: 29271481 Free PMC article. Updated.
-
Regional cerebral blood flow single photon emission computed tomography for detection of Frontotemporal dementia in people with suspected dementia.Cochrane Database Syst Rev. 2015 Jun 23;2015(6):CD010896. doi: 10.1002/14651858.CD010896.pub2. Cochrane Database Syst Rev. 2015. PMID: 26102272 Free PMC article.
-
Sertindole for schizophrenia.Cochrane Database Syst Rev. 2005 Jul 20;2005(3):CD001715. doi: 10.1002/14651858.CD001715.pub2. Cochrane Database Syst Rev. 2005. PMID: 16034864 Free PMC article.
-
Systemic pharmacological treatments for chronic plaque psoriasis: a network meta-analysis.Cochrane Database Syst Rev. 2021 Apr 19;4(4):CD011535. doi: 10.1002/14651858.CD011535.pub4. Cochrane Database Syst Rev. 2021. Update in: Cochrane Database Syst Rev. 2022 May 23;5:CD011535. doi: 10.1002/14651858.CD011535.pub5. PMID: 33871055 Free PMC article. Updated.
References
-
- Acharya, R. P. , Maraseni T., and Cockfield G.. 2019. “Global Trend of Forest Ecosystem Services Valuation–An Analysis of Publications.” Ecosystem Services 39: 100979.
-
- Andrés, C. , and Ojeda F.. 2002. “Effects of Afforestation With Pines on Woody Plant Diversity of Mediterranean Heathlands in Southern Spain.” Biodiversity and Conservation 11: 1511–1520.
-
- Baltzinger, M. , Archaux F., Gosselin M., and Chevalier R.. 2011. “Contribution of Forest Management Artefacts to Plant Diversity at a Forest Scale.” Annals of Forest Science 68: 395–406.
-
- Barnes, P. W. , and Archer S.. 1999. “Tree‐Shrub Interactions in a Subtropical Savanna Parkland: Competition or Facilitation?” Journal of Vegetation Science 10: 525–536.
-
- Baughman, C. A. , Loehman R. A., Magness D. R., Saperstein L. B., and Sherriff R. L.. 2020. “Four Decades of Land‐Cover Change on the Kenai Peninsula, Alaska: Detecting Disturbance‐Influenced Vegetation Shifts Using Landsat Legacy Data.” Landscape 9: 382.
LinkOut - more resources
Full Text Sources
