

Limited Evidence for Depth Specialism in Isolated Seamount Reef Predators
- PMID: 40896105
- PMCID: PMC12391911
- DOI: 10.1002/ece3.72044
Limited Evidence for Depth Specialism in Isolated Seamount Reef Predators
Abstract
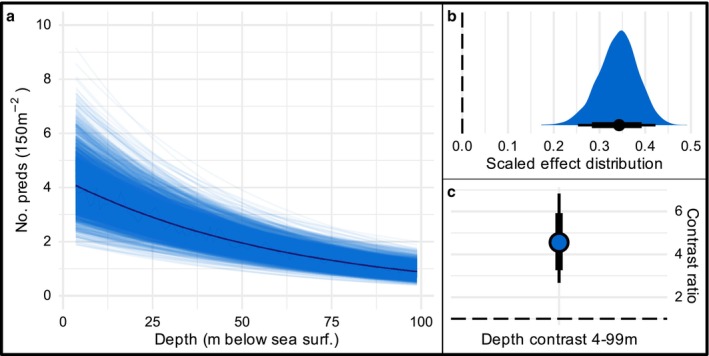
Gradients in light, temperature and hydrodynamics associated with water depth are important determinants of ecological communities in marine environments. While depth specialism in coral reef fishes has been extensively studied in shallow (< 30 m) coastal reef systems, less is known about how depth-associated drivers operate over the larger depth ranges on isolated pinnacle and seamount reef systems, which are known to support abundant assemblages of predatory fishes. Using remotely operated vehicles, we surveyed predatory fish assemblages across a 100 m depth gradient on three seamount reefs in the Coral Sea. We tested for declines in abundance and diversity, as well as differences in assemblage structure of predatory fishes among depth strata. Species richness and abundance decreased significantly with depth, with predator abundance declining fourfold between the shallowest (5 m) and deepest (95 m) depths surveyed, while species richness was halved. Despite this, compositional differences among depth zones were minimal, with most taxa spanning the full depth range, suggesting adaptations to the limited horizontal habitat available on seamounts. Depth-associated shifts in taxonomic composition were primarily attributed to a single predator family, reef sharks (Carcharhinidae), which increased in abundance at mesophotic depths. The capacity of a large number of predatory fish taxa to utilize a wide range of depths allows these organisms to access favoured thermal environments and may be a potential resilience mechanism under future environmental change. Further studies are needed to assess the implications of depth use for predator behaviour, trophodynamics and conservation strategies.
Keywords: MCE; depth; pinnacle; predatory fishes; seamount coral reef.
© 2025 The Author(s). Ecology and Evolution published by British Ecological Society and John Wiley & Sons Ltd.
Conflict of interest statement
The authors declare no conflicts of interest.
Figures


Similar articles
-
Prescription of Controlled Substances: Benefits and Risks.2025 Jul 6. In: StatPearls [Internet]. Treasure Island (FL): StatPearls Publishing; 2025 Jan–. 2025 Jul 6. In: StatPearls [Internet]. Treasure Island (FL): StatPearls Publishing; 2025 Jan–. PMID: 30726003 Free Books & Documents.
-
Vulnerability of tropical fish communities across depth in the central Indian Ocean.Conserv Biol. 2025 Jul 3:e70085. doi: 10.1111/cobi.70085. Online ahead of print. Conserv Biol. 2025. PMID: 40605759
-
Cryptobenthic crab assemblages are more distinct across a 90 m depth gradient than 2500 km of shallow marine habitat in the Hawaiian archipelago.Sci Rep. 2025 Jul 28;15(1):27419. doi: 10.1038/s41598-025-10232-6. Sci Rep. 2025. PMID: 40721714 Free PMC article.
-
The Black Book of Psychotropic Dosing and Monitoring.Psychopharmacol Bull. 2024 Jul 8;54(3):8-59. Psychopharmacol Bull. 2024. PMID: 38993656 Free PMC article. Review.
-
Global consequences of dam-induced river fragmentation on diadromous migrants: a systematic review and meta-analysis.Biol Rev Camb Philos Soc. 2025 Oct;100(5):2020-2037. doi: 10.1111/brv.70032. Epub 2025 May 7. Biol Rev Camb Philos Soc. 2025. PMID: 40338041 Free PMC article.
References
-
- Andradi‐Brown, D. A. , Gress E., Wright G., Exton D. A., and Rogers A. D.. 2016. “Reef Fish Community Biomass and Trophic Structure Changes Across Shallow to Upper‐Mesophotic Reefs in the Mesoamerican Barrier Reef, Caribbean.” PLoS One 11, no. 6: 1–19. 10.1371/journal.pone.0156641. - DOI - PMC - PubMed
-
- Bellwood, D. R. , Wainwright P. C., Fulton C. J., and Hoey A.. 2002. “Assembly Rules and Functional Groups at Global Biogeographical Scales.” Functional Ecology 16, no. 5: 557–562. https://www.jstor.org/stable/826738.
LinkOut - more resources
Full Text Sources
