. 2025 Aug 12;36(3):102680.
doi: 10.1016/j.omtn.2025.102680. eCollection 2025 Sep 9.

RNA trans-splicing to rescue β-catenin: A novel approach for treating CTNNB1-Haploinsufficiency disorder

Affiliations

RNA trans-splicing to rescue β-catenin: A novel approach for treating CTNNB1-Haploinsufficiency disorder

Matea Maruna et al. Mol Ther Nucleic Acids. .

Abstract

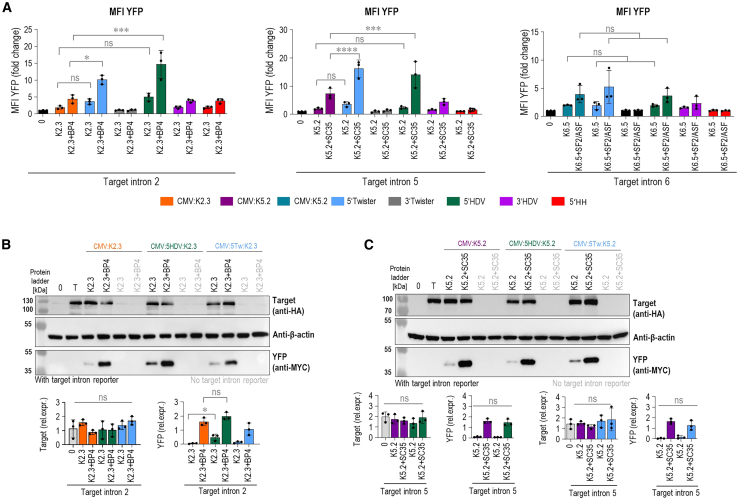
Loss-of-function mutations in the CTNNB1 gene cause β-catenin deficiency, resulting in CTNNB1 syndrome, a rare neurodevelopmental disorder characterized by motor and cognitive impairments. Given the wide variety of mutations across CTNNB1 and its dosage sensitivity, a mutation-independent therapeutic approach that preserves endogenous gene regulation is critically needed. This study introduces spliceosome-mediated RNA trans-splicing as a novel approach to restore β-catenin production. Pre-trans-splicing RNA molecules (PTMs) targeting CTNNB1 introns 2, 5, and 6 were designed and evaluated using a split yellow fluorescent protein reporter system. Rationally designed short antisense RNAs, which mask splicing regulatory elements, significantly enhanced PTM-mediated trans-splicing at both mRNA and protein levels. Additionally, introducing a self-cleaving ribozyme at the PTM's 5' end further improved trans-splicing efficiency, likely due to increased nuclear retention. CMV promoter-driven PTM expression yielded the highest efficiency. Importantly, successful trans-splicing of the endogenous CTNNB1 transcript confirmed the physiological relevance of this strategy. This study is the first to apply and optimize spliceosome-mediated RNA trans-splicing (SMaRT) for CTNNB1 mRNA correction, providing a promising, mutation-agnostic approach for treating CTNNB1 syndrome.

Keywords: CTNNB1 syndrome; MT: RNA/DNA Editing; RNA therapy; rare disease; ribozymes; small antisense RNA; trans-splicing.


Conflict of interest statement

The authors declare no competing interests.

Figures

None
Graphical abstract
Figure 1
Figure 1
Trans-splicing mechanism and PTM candidate screening using a split YFP target intron reporter for efficient trans-splicing (A) Following transcription, the CTNNB1 gene is transcribed into pre-mRNA containing a CTNNB1-associated mutation, leading to the loss of β-catenin expression. A PTM is introduced into the cells to induce trans-splicing and outcompete cis-splicing, resulting in the formation of chimeric mRNA without the mutation, thereby rescuing β-catenin expression. (B and C) Composition of the split YFP target intron reporter: it consists of the target mRNA and PTM candidate. The target mRNA, expressed under the CMV promoter, contains the N-terminal domain of YFP, a target intron, and downstream exons. The PTM molecule, expressed under the U6 promoter, includes a binding domain (BD), intronic sequence (spacer, branchpoint [BP], polypyrimidine tract [ppt], and 3′ splice site [3′ SS]), the C-terminal domain of YFP, and a myc-tag. Accurate trans-splicing results in the fusion of both YFP domains into a functional protein, detected as fluorescence via flow cytometry. (D and E) Quantitation of flow cytometry for PTM screening targeting introns 2, 3, 5, and 6 was performed using the split YFP target intron reporter. Negative controls included PTM K.NT with a randomly generated BD, target intron reporter transfected alone (0), and PTM candidate transfected without the target intron reporter. Quantitation by flow cytometry was presented as the percentage of YFP+ cells and the YFP MFI normalized to the target intron reporter-only control (0) for the four different introns—2, 3, 5, and 6. (F) Spontaneous association of the translated N- and C-terminal YFP due to overexpression was tested using flow cytometry. The PTM candidates (K2.3, K5.2, and K6.5) were tested with a reporter lacking the target intron to assess any spontaneous association of the translated N- and C-terminal YFP. The results are presented as the percentage of YFP+ cells. The negative controls consisted of the reporter lacking the target intron transfected alone, and PTM transfected alone without the reporter. (D, E, and F) Data are presented as the mean value ±SD from at least three independent experiments. Comparison to the target intron reporter only (target only) was analyzed using ordinary one-way ANOVA with Dunnett’s multiple comparison test. ∗∗∗∗p < 0.0001; ∗∗∗p < 0.001; ∗∗p < 0.01; ∗p < 0.05; nonsignificant (ns).
Figure 2
Figure 2
Short asRNAs enhance trans-splicing efficiency for CTNNB1 introns in the target intron reporter (A) A schematic representation illustrates the mechanism by which short asRNAs block cis-splicing. The 30- to 35-nt-long asRNAs are designed to target regions from the BP to the 3′ SS in the target intron, as well as ESEs within the first exon downstream of the target intron. (B) The short asRNAs consist of an antisense sequence (as) coupled with a modified U7 Sm OPT core, which binds Sm proteins found in spliceosomal snRNAs, along with a U7 snRNA scaffold. Chimeric U7-antisense sequences are expressed under the control of a strong Pol II U1 snRNA gene promoter and termination sequence. (C) The positions of short asRNAs targeting SSs and ESEs are mapped in target introns 2, 5, and 6, and their respective first downstream exons 3, 6, and 7. (D and E) The detection of enhanced trans-splicing efficiency by adding short asRNAs was performed using flow cytometry. Negative controls included cells transfected with the target intron reporter alone (0), the PTM candidate transfected alone, or the PTM candidate and asRNA transfected alone. Quantitation by flow cytometry is presented as the percentage of YFP+ cells (D) and the YFP MFI (E) normalized to the reporter-only control (0) for the three different introns—2, 5, and 6. Data are presented as the mean value ±SD from at least three independent experiments. Comparison to the PTM candidate co-transfected with the target intron reporter was analyzed using ordinary one-way ANOVA with Dunnett’s multiple comparison test. ∗∗∗∗p < 0.0001; ∗∗∗p < 0.001; ∗∗p < 0.01; ∗p < 0.05; nonsignificant (ns).
Figure 3
Figure 3
Detection of trans-splicing efficiency at the mRNA and protein levels (A) Western blot depicting reconstituted YFP upon PTM and asRNA-facilitated trans-splicing of the reporters containing target introns 2, 5, and 6. On transfection, cell lysates were subjected to SDS-PAGE and western blotting with cis-spliced reporter detected via HA-tag and trans-spliced reporter detected via nYFP-myc-tag. A representative western blot of three independent experiments is shown. 0 represents negative control–cells transfected with an empty plasmid vector (pcDNA3); T represents negative control–target intron reporter transfected alone; PTM and asRNA transfected with target intron reporter are marked in black; PTM and asRNA transfected without target intron reporter are marked in gray. All uncropped blots used for analysis can be found in Figure S12. (B) A schematic representation illustrating the position and size of qPCR and semi-qPCR amplified segments in the detection of cis- and trans-splicing in (C–G). (C–E) Gel electrophoresis representing semi-qPCR-amplified segments of nYFP-myc-tag junction (759 bp), indicative of reporter trans-splicing. Bands numbered 1–7 (C) were isolated from the gel and submitted to Sanger sequencing, with the obtained sequences corresponding to the nYFP-myc-tag junction (D). (F) qPCR-determined relative abundances of the mRNA segment from the cYFP-myc-tag junction (265 bp) indicative of trans-splicing. Fold increase is calculated compared with samples transfected with PTM only. GAPDH was used as the reference, and the ΔΔCT method was used for quantification. (G) qPCR-determined relative abundances of the segment from the nYFP and cis-spliced exon junction indicative of cis-splicing. Fold increase is calculated compared with samples transfected with PTM only. GAPDH was used as the reference, and the ΔΔCT method was used for quantification. (A) Statistical comparisons to the reporter-only control (0) and among tested groups were performed using ordinary one-way ANOVA followed by Dunnett’s multiple comparisons test. ∗∗p < 0.01; ∗p < 0.05; nonsignificant (ns). (F–G) Comparison of PTM candidate and asRNA co-transfection to PTM candidate only was analyzed using two-way (F) or ordinary one-way (G) ANOVA with Dunnett’s multiple comparison test. ∗∗∗∗p < 0.0001; ∗∗∗p < 0.001; ∗∗p < 0.01; ∗p < 0.05; nonsignificant (ns).
Figure 4
Figure 4
Addition of Twister and HDV ribozymes to the 5′ end of PTM enhanced trans-splicing efficiency (A) Schematic example of a PTM targeting intron with added ribozymes on either 5′ or 3′ ends to remove capping or polyadenylation. (B) Determination of trans-splicing efficiency for the PTM K2.3, PTM K5.2, and PTM K6.5 by using flow cytometry. Negative control included the target intron reporter transfected alone (0). Quantitation by flow cytometry is presented as the YFP MFI normalized to the reporter-only control (0) for the introns 2, 5, and 6. Data are presented as the mean value ±SD from at least three independent experiments. (C) Detection of trans-splicing efficiency for the PTM K2.3 and K5.2 with ribozymes placed at the 5′ end as restoration of full-length YFP by western blot analysis using the corresponding anti-myc, anti-HA, and β-actin antibodies. 0 represents negative control–cells transfected with an empty plasmid vector (pcDNA3); T represents negative control–target intron reporter transfected alone; PTM and asRNA transfected with target intron reporter are marked in black; PTM and asRNA transfected without target intron reporter are marked in gray. Data are representative of three independent experiments. All uncropped blots used for analysis can be found in Figures S13 and S14. (D and E) A decrease in trans-splicing efficiency of PTM K2.3 bearing catalytically inactive HDV and Twister ribozyme on its 5′ end was measured by flow cytometry measurement of reconstituted YFP (D) or via qPCR-determined relative abundance of nYFP-myc-tag junction (E). Negative control (0) for the flow cytometry included the target intron reporter transfected alone. Results are presented as the YFP MFI normalized to the reporter-only control (0). qPCR results are expressed as fold increase, calculated compared with samples transfected with PTM only. GAPDH was used as the reference, and the ΔΔCT method was used for quantification. (F) Relative luminescence upon co-transfection of TopFlash reporter plasmid with optimized K2.3 and/or target intron reporter with or without target intron. (B–F) Data are presented as the mean value ±SD from at least three independent experiments. (B, D, and F) Comparison between the tested groups was analyzed using one-way ANOVA with Dunnett’s multiple comparison test. ∗∗∗∗p < 0.0001; ∗∗∗p < 0.001; ∗p < 0.05; nonsignificant (ns).
Figure 5
Figure 5
Expression of PTMs K2.3 and K5.2 under the CMV promoter improved trans-splicing efficiency (A) Testing of PTM K2.3, K5.2, and K6.5 expressed under U6, CMV, and U1 promoters for the trans-splicing efficiency using flow cytometry. Negative controls included cells transfected with the target intron reporter alone, the PTM candidate alone, the PTM candidate, and asRNA without the target intron reporter. Results are shown as YFP MFI normalized to negative control–target intron reporter transfected alone (0). Data are presented as the mean value ±SD from at least three independent experiments. Comparison between the tested groups was analyzed using one-way ANOVA with Dunnett’s multiple comparison test. ∗∗∗∗p < 0.0001; ∗∗p ≤ 0.01; ∗p < 0.05; nonsignificant (ns). (B and D) Trans-splicing efficiency of PTM K2.3 (B) and PTM K5.2 (D) expressed under U6, CMV, and U1 was verified using western blot. 0 represents negative control–cells transfected with an empty plasmid vector (pcDNA3); T represents negative control–target intron reporter transfected alone; PTMs and asRNAs transfected with target intron reporter are marked in black; PTMs and asRNAs transfected without target intron reporter are marked in gray. Data are representative of three independent experiments. Analysis of three biological replicates is provided in the charts and presented as the mean value ±SD. Myc-tag (YFP) levels were first normalized to β-actin and then to HA-tag (target). HA-tag levels were normalized to β-actin. Samples with no detectable band signal were quantified as zero. Comparison between the tested groups was analyzed using one-way ANOVA with Dunnett’s multiple comparison test. ∗∗p ≤ 0.01; ∗p < 0.05; nonsignificant (ns). All uncropped blots used for analysis can be found in Figure S15. (C) Comparison of PTM K2.3 expressed under U6 and CMV promoters by using qPCR with specific primers designed to detect PTM expression. Expression of K2.3 from CMV was normalized to expression of K2.3 expressed under the U6 promoter. Comparison to K2.3 expressed under the U6 promoter was analyzed using Student’s t test (two populations). ∗p < 0.05; nonsignificant (ns).
Figure 6
Figure 6
Combination of 5′ ribozymes and CMV expression of PTM K2.3, K5.2, and K6.5 leads further to increased trans-splicing efficiency (A) Testing of PTM K2.3, K5.2, and K6.5 expressed under the CMV promoter with added HH, HDV, and Twister ribozymes on either 5′ or 3′ end of PTM. Trans-splicing efficiency is detected as reconstitution of YFP detected with flow cytometry. Negative control included the target intron reporter transfected alone (0). Results are presented as the YFP MFI normalized to the reporter-only control. Data are presented as the mean value ±SD from at least three independent experiments. (B and C) Western blot analysis of trans-splicing efficiency induced by PTMs K2.3 and K5.2 expressed under the CMV promoter with either 5′ HDV or Twister ribozyme. 0 represents negative control–cells transfected with an empty plasmid vector (pcDNA3); T represents negative control–target intron reporter transfected alone; PTMs and asRNAs transfected with target intron reporter are marked in black; PTMs and asRNAs transfected without target intron reporter are marked in gray. Data are representative of three independent experiments. Analysis of three biological replicates is provided in the charts and presented as the mean value ±SD. Samples with no detectable band signal were quantified as zero. Myc-tag (YFP) levels were first normalized to actin and then to HA-tag (target). HA-tag levels were normalized to actin. All uncropped blots used for analysis can be found in Figure S16. (A–C) Data are representative of three independent experiments. Comparison between the tested groups was analyzed using one-way ANOVA with Dunnett’s multiple comparison test. ∗∗∗∗p < 0.0001; ∗∗∗p < 0.001; ∗p < 0.05; nonsignificant (ns).
Figure 7
Figure 7
Endogenous detection of trans-splicing efficiency in HEK293T cells (A) Schematic example of best-performing PTM K2.3 with coding CTNNB1 region targeting endogenous CTNNB1 intron 2. The result of trans-splicing is trans-spliced CTNNB1 mRNA that contains the endogenous CTNNB1 region upstream from the target intron (yellow exons) and the exogenous CTNNB1 region with myc-tag from the PTM candidate. To detect trans-spliced mRNA by using PCR, specific primers (asterisks marked in red) were designed to detect exon 2 and the myc-tag from the PTM K2.3. The size of the band that corresponds to trans-spliced mRNA is 2,435 bp. (B) Correctly trans-spliced CTNNB1 mRNA was detected 48 h after transfection by using semi-qPCR. HEK293T cells transfecting with empty vector (pcDNA3) were used as a negative control. (C) Sanger sequencing of the PCR product further confirmed the accuracy of the trans-splicing in HEK293T cells. Bands labeled 1 and 2 were excised from the gel and subsequently sent for Sanger sequencing. Data are representative of two independent experiments. (D) Schematic representation of the key optimizations implemented in this study to enhance trans-splicing efficiency. The incorporation of 5′ ribozymes into PTMs expressed under the CMV promoter, combined with asRNAs designed to inhibit cis-splicing, resulted in an improvement of trans-splicing efficiency.

Similar articles

References

    1. López-Rivera J.A., Pérez-Palma E., Symonds J., Lindy A.S., McKnight D.A., Leu C., Zuberi S., Brunklaus A., Møller R.S., Lal D. A catalogue of new incidence estimates of monogenic neurodevelopmental disorders caused by de novo variants. Brain J. Neurol. 2020;143:1099–1105. doi: 10.1093/brain/awaa051. - DOI - PMC - PubMed
    1. de Ligt J., Willemsen M.H., van Bon B.W.M., Kleefstra T., Yntema H.G., Kroes T., Vulto-van Silfhout A.T., Koolen D.A., de Vries P., Gilissen C., et al. Diagnostic Exome Sequencing in Persons with Severe Intellectual Disability. N. Engl. J. Med. 2012;367:1921–1929. doi: 10.1056/NEJMoa1206524. - DOI - PubMed
    1. Verhoeven W.M.A., Egger J.I.M., Jongbloed R.E., van Putten M.M., de Bruin-van Zandwijk M., Zwemer A.-S., Pfundt R., Willemsen M.H. A de novo CTNNB1 Novel Splice Variant in an Adult Female with Severe Intellectual Disability. Int. Med. Case Rep. J. 2020;13:487–492. doi: 10.2147/IMCRJ.S270487. - DOI - PMC - PubMed
    1. Miroševič Š., Khandelwal S., Sušjan P., Žakelj N., Gosar D., Forstnerič V., Lainšček D., Jerala R., Osredkar D. Correlation between Phenotype and Genotype in CTNNB1 Syndrome: A Systematic Review of the Literature. Int. J. Mol. Sci. 2022;23 doi: 10.3390/ijms232012564. - DOI - PMC - PubMed
    1. Kuechler A., Willemsen M.H., Albrecht B., Bacino C.A., Bartholomew D.W., van Bokhoven H., van den Boogaard M.J.H., Bramswig N., Büttner C., Cremer K., et al. De novo mutations in beta-catenin (CTNNB1) appear to be a frequent cause of intellectual disability: expanding the mutational and clinical spectrum. Hum. Genet. 2015;134:97–109. doi: 10.1007/s00439-014-1498-1. - DOI - PubMed

LinkOut - more resources