. 2025 Aug 5;36(3):102665.
doi: 10.1016/j.omtn.2025.102665. eCollection 2025 Sep 9.

A combinatorial oligonucleotide therapy to improve dystrophin restoration and dystrophin-deficient muscle health

Affiliations

A combinatorial oligonucleotide therapy to improve dystrophin restoration and dystrophin-deficient muscle health

Young Jae Moon et al. Mol Ther Nucleic Acids. .

Abstract

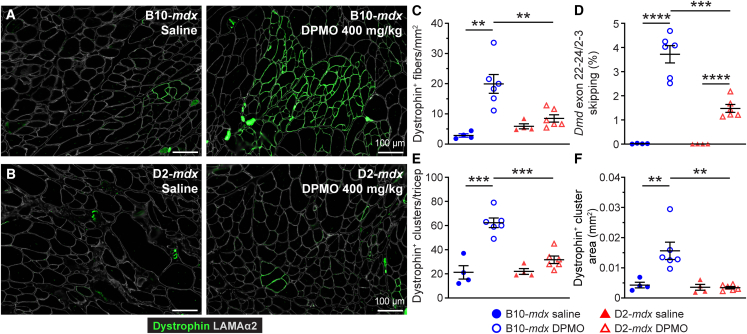
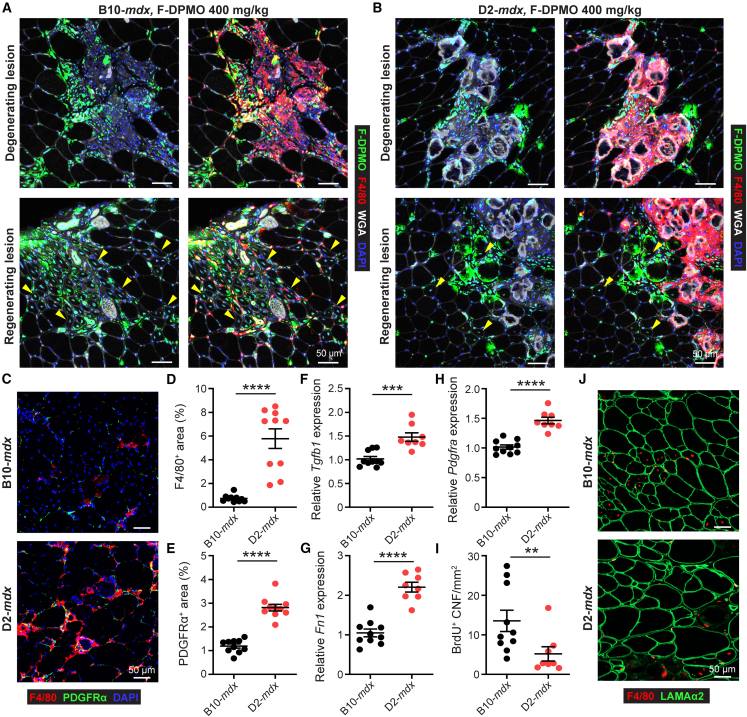
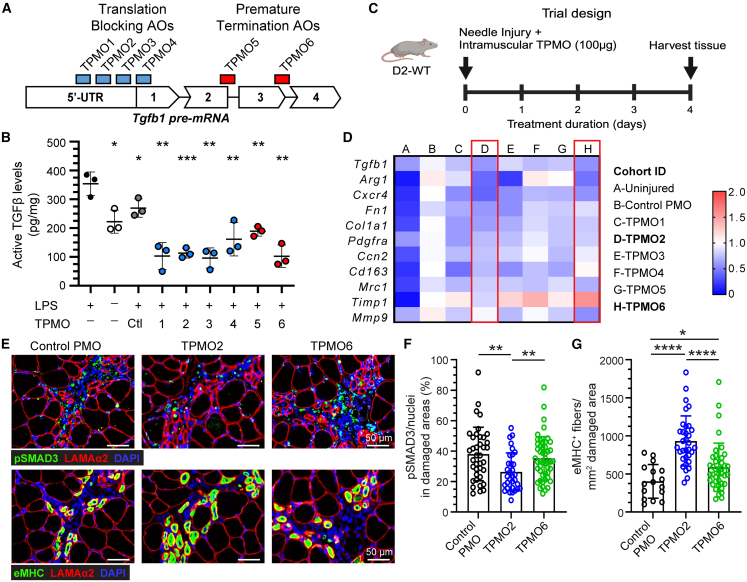
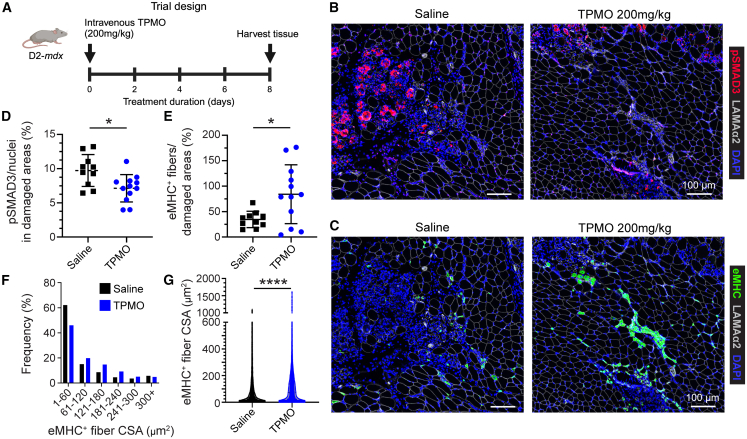
Despite the proven safety of dystrophin-targeting phosphorodiamidate morpholino oligomer (PMO) therapy, poor delivery of the PMOs limit the efficacy of this dystrophin restoring gene therapy for Duchenne muscular dystrophy (DMD). Limited myogenesis and excessive fibrosis in DMD are pathological features that contribute to the poor efficacy of PMOs. We show that the severe DMD mouse model (D2-mdx) not only replicates these pathological features of DMD but also mirrors the resulting PMO-mediated dystrophin restoration deficit. High transforming growth factor β (TGF-β) activity, which is a common feature of DMD patient and D2-mdx muscles, limits myogenesis and causes fibrosis. We developed a TGF-β-targeting PO (TPMO), which when used acutely, lowered macrophage TGF-β activity and signaling in the dystrophic muscle, enhanced muscle regeneration, and enhanced dystrophin restoration when used in combination with dystrophin exon skipping PMO (DPMO). Chronic use of this combination PMO therapy in D2-mdx mice reduced muscle fibrosis and muscle loss, allowed dystrophin restoration in skeletal muscle and heart, and led to an overall enhancement of skeletal muscle function. This approach leverages the safety of PMO-based therapy and represents the first combination PMO treatment for DMD that simultaneously enhances dystrophin restoration, reduces fibrosis, and alleviates myogenic deficits to ultimately improve health and function of dystrophic muscles.

Keywords: Duchenne muscular dystrophy, DMD; MT: Oligonucleotides: Therapies and Applications; PMO; TGF-β; exon skipping; fibroadipogenic; fibrosis; inflammation; muscle regeneration; myogenesis; phosphoro-diamidate morpholino oligomer; transforming growth factor β.


Conflict of interest statement

J.K.J., J.S.N., and Y.J.M. have filed a provisional intellectual property application related to the novel therapeutic strategies disclosed in this manuscript.

Figures

None
Graphical abstract
Figure 1
Figure 1
Poor dystrophin restoration by systemic dystrophin-targeting PMO therapy in D2-mdx compared to B10-mdx model D2-mdx or B10-mdx mice were administrated systemic dystrophin-targeting PMO (DPMO) via the retroorbital sinus (400 mg/kg, exon 23 skipping PMO) at 20 weeks old. (A and B) Dystrophin expression shown in D2-mdx or B10-mdx triceps 2 weeks after i.v. injection of DPMO. Scale bars represent 100 μm. (C) Quantification of the number of dystrophin-positive fibers per triceps muscle in the total area. (D) Exon skipping was quantified from the triceps by RT-qPCR. The degree of exon skipping was calculated as the percentage of exon 22–24 mRNA expression of Dmd relative to exon 2–3 mRNA expression. (E) Quantification of the number of dystrophin-positive clusters in the triceps muscle. (F) Quantification of the average area of dystrophin-positive clusters within the triceps muscle. Data are represented as a scatterplot with SD; saline n = 4, DPMO n = 6. ∗∗p < 0.01, ∗∗∗p < 0.001, and ∗∗∗∗p < 0.0001 using unpaired t test (D) and Mann-Whitney test (C, E, and F).
Figure 2
Figure 2
Reduced DPMO delivery in D2-mdx occurs despite elevated levels of inflammation (A and B) D2-mdx or B10-mdx mice were administrated systemic FITC-DPMO (F-DPMO) via the retroorbital sinus (400 mg/kg) at 20 weeks old. IF images showing F-DPMO and F4/80 (marker for macrophage) localization in degenerating lesion and regenerating lesion in or B10-mdx mice or D2-mdx triceps. (C) IF images from B10-mdx and D2-mdx (20 weeks old) triceps muscle sections stained to F4/80 and PDGFRα (marker for fibroadipogenic progenitor (FAP) cells). (D and E) Quantification of F4/80+ area (%) and PDGFRα+ area (%) per total cross-sectional area (CSA) (n = 10). (F–H) Gene expression analysis of fibrosis markers, Tgfb1, Fn1, and PDGFRα from B10-mdx (n = 10) and D2-mdx (n = 8) triceps muscle. (I) Quantification of BrdU+ CNFs in total triceps muscle from B10-mdx (n = 10) and D2-mdx (n = 8). Scale bars represent 50 μm. (J) IF images of muscle sections from B10-mdx and D2-mdx (20 weeks old) triceps muscle sections stained to identify muscle fibers BrdU+ CNFs; sections co-stained with Laminin-α2 and DAPI. Mice were administrated BrdU for one week and examined two weeks later. ∗∗p < 0.01, ∗∗∗p < 0.001, and ∗∗∗∗p < 0.0001 using unpaired t test (E, G, and H) and Mann-Whitney test (D, F, and I).
Figure 3
Figure 3
Design and development of Tgfb1-targeted PMOs (A) Scheme representing PMO target sites within the 5′ UTR and exon boundaries to block translation or elicit out-of-frame premature termination. (B) Active levels of TGF-β in LPS-stimulated RAW 264.7 cells (macrophages) treated with Tgfb1-targeted PMOs (TPMOs) targeting Tgfb1. (C) Schematic showing intramuscular (TA, tibialis anterior) TPMOs injection with multiple needle injury experimental design to identify the efficacy of TPMOs in D2-WT (12 weeks old, n = 4). (D) Heatmap of Tgfb1 and TGF-β target genes expression in TA depicting fold change for each TPMO. (E) IF images showing control PMO, TPMO2, and TPMO6-treated D2-WT TA cross-sections stained to pSMAD3, which is a mediator of TGF-β signaling, and eMHC; sections co-stained with Laminin-α2 (red) and DAPI (blue). Scale bars represent 50 μm. (F and G) Quantifying the percentage of pSMAD3 positive area relative to DAPI area in the damaged muscle area (F) and the number of eMHC+ fibers in the damaged area (G) from control PMO, TPMO2, and TPMO6-treated D2-WT TA. ∗p < 0.05, ∗∗p < 0.01, and ∗∗∗∗p < 0.0001 using unpaired t-test (B) and Mann-Whitney test (F and G).
Figure 4
Figure 4
Systemic TPMO treatment to lower TGFβ activity and enhance muscle regeneration in D2-mdx (A) Schematic showing experimental design for assessing the impact of systemic TPMO treatment (200 mg/kg) on juvenile D2-mdx mice (3 weeks old, n = 6). (B and C) IF images showing pSMAD3 expression and numbers of eMHC+ regenerating myofibers following systemic administration of control PMO or TPMO2 in D2-mdx. (D and E) Corresponding quantification of (D) pSMAD3 expression and (E) eMHC+ fibers in damaged muscle areas following TPMO therapy. Scale bars represent 100 μm. Data are represented as a scatterplot with SD from n = 12 per group. (F) Frequency distribution and (G) total size of eMHC+ myofiber cross-sectional area (CSA) following TPMO2 therapy. ∗p < 0.05 and ∗∗∗∗p < 0.0001 using unpaired t test (D and E) and Mann-Whitney test (G).
Figure 5
Figure 5
Dystrophin restoration by acute dual PMO (TPMO, DPMO) therapy in D2-mdx (A) Schematic showing experimental design for assessing the benefit of local (IM) treatment with TPMO2 (100 μg/TA) on dystrophin restoration by systemic DPMO treatment (200 mg/kg) in adult D2-mdx mice. (B) IF images showing dystrophin expression, BrdU+ regenerating myofibers, F4/80 expression, and PDGFRα expression following IM TPMO+i.v. DPMO administration, relative IM control PMO+i.v. DPMO. Scale bars represent 50 μm. (C) Quantification of dystrophin+ myofibers per TA muscle following therapy (n = 12). (D) Quantification of BrdU+ centrally nucleated fibers (CNFs) per TA muscle (n = 12). (E and F) Violin plots showing the percentage of F4/80 (E) or PDGFRα (F) staining in damaged TA muscle areas after treatment. Data are represented as scatterplot with SD. ∗∗p < 0.01, ∗∗∗p < 0.001, and ∗∗∗∗p < 0.0001 using unpaired t test (D) and Mann-Whitney test (C, E, and F).
Figure 6
Figure 6
Chronic dual PMO therapy to enhance dystrophin restoration and mitigate fibrosis in D2-mdx (A) Schematic showing experimental design for long-term TPMO+DPMO treatment in juvenile D2-mdx mice (3 weeks old, n = 7–8). A cocktail of TPMO (200 mg/kg) and DPMO (200 mg/kg) was injected via the retroorbital sinus twice a week (saline used as control). IF was performed on the left gastrocnemius, which did not receive functional testing. (B–D) IF images showing dystrophin expression levels (B) and corresponding quantification of dystrophin+ fibers (C) and dystrophin+ CNFs (D). Scale bars represent 100 μm. (E) Dystrophin protein levels were determined by Wes capillary electrophoresis immunoassay. (F) Wes quantification in gastrocnemius of dual PMO-treated or saline-treated D2-mdx. The dystrophin expression of saline-treated or dual PMO-treated D2-mdx muscle is shown compared to the dystrophin expression of WT muscle. (G) WGA and (H) Sirius red staining to assess the extent of extracellular matrix and collagen deposition, respectively, in response to dual PMO-treatment or saline treatment. (I) Quantification of WGA-stained area per total tissue cross-sectional area with treatment. (J–L) Gene expression analysis of fibrosis markers, Tgfb1, Col1a1, and Mmp9 in response to dual PMO-treated and saline-treated cohorts. Data are represented as a scatterplot with SD from n = 7–8 per group. ∗p < 0.05, ∗∗p < 0.01, ∗∗∗p < 0.001, and ∗∗∗∗p < 0.0001 using unpaired t test (C, F, J, K, and L) and Mann-Whitney test (D and I).
Figure 7
Figure 7
Benefits of chronic dual PMO (TPMO and DPMO) therapy for skeletal and cardiac muscle in D2-mdx Juvenile D2-mdx mice were treated with a cocktail of TPMO and DPMO as described previously. Functional analysis was performed starting the 5th week of treatment prior to harvesting muscles. (A and B) In vivo isometric force frequency plot and maximal isometric force in dual TPMO+DPMO-treated vs. saline-treated D2-mdx gastrocnemius muscle. (C and D) Forelimb grip strength (C) and timed wire hang (D) functional outcome measure following treatment. (E) IF images showing expression and localization of β-dystroglycan, dystrobrevin, and α-sarcoglycan in dual PMO-treated D2-mdx gastrocnemius muscles, compared to saline-treated controls. Asterisks mark the orientation of myofibers between adjacent serial sections. Sections were co-stained with WGA. Scale bars represent 50 μm. (F) IF images showing dystrophin expression levels within D2-mdx heart tissue following long-term systemic dual PMO therapy. Scale bars represent 50 μm. (G and H) Corresponding quantification of dystrophin+ cardiomyocytes per heart (G) and dystrophin+ cardiomyocyte clusters per heart cross-section (H) following long-term systemic dual PMO therapy. Data are represented as a scatterplot with SD from n = 7–8 per group. ∗p < 0.05, ∗∗∗p < 0.001, and ∗∗∗∗p < 0.0001 using unpaired t test (A–C) and Mann-Whitney test (D, G, and H).

References

    1. Crisafulli S., Sultana J., Fontana A., Salvo F., Messina S., Trifirò G. Global epidemiology of Duchenne muscular dystrophy: an updated systematic review and meta-analysis. Orphanet J. Rare Dis. 2020;15:141. doi: 10.1186/s13023-020-01430-8. - DOI - PMC - PubMed
    1. Blake D.J., Weir A., Newey S.E., Davies K.E. Function and genetics of dystrophin and dystrophin-related proteins in muscle. Physiol. Rev. 2002;82:291–329. doi: 10.1152/physrev.00028.2001. - DOI - PubMed
    1. Ervasti J.M., Campbell K.P. Membrane organization of the dystrophin-glycoprotein complex. Cell. 1991;66:1121–1131. doi: 10.1016/0092-8674(91)90035-w. - DOI - PubMed
    1. Duan D., Goemans N., Takeda S., Mercuri E., Aartsma-Rus A. Duchenne muscular dystrophy. Nat. Rev. Dis. Primers. 2021;7:13. doi: 10.1038/s41572-021-00248-3. - DOI - PMC - PubMed
    1. Mercuri E., Bönnemann C.G., Muntoni F. Muscular dystrophies. Lancet. 2019;394:2025–2038. doi: 10.1016/S0140-6736(19)32910-1. - DOI - PubMed

LinkOut - more resources