

Marker genes reveal dynamic features of cell evolving processes
- PMID: 40896714
- PMCID: PMC12396811
- DOI: 10.1093/bioadv/vbaf185
Marker genes reveal dynamic features of cell evolving processes
Abstract
Motivation: Embryonic cells finally evolve into various types of mature cells, where cell fate determinations play pivotal roles, but dynamic features of this process remain elusive.
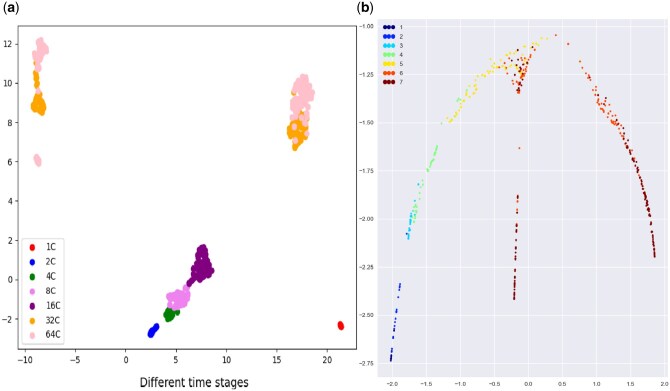
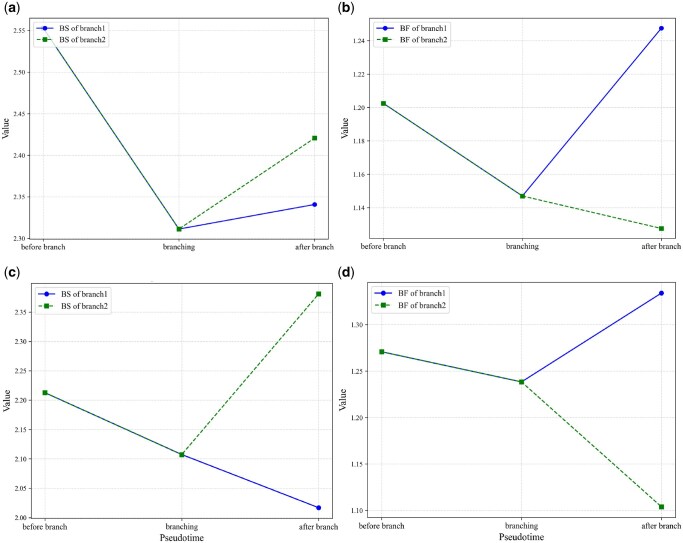
Results: We analyze four single-cell RNA sequencing datasets on mouse embryo cells, mouse embryonic fibroblasts, human bone marrow, and intestine organoid. We show that key (high expression) genes of each organism exhibit different statistical features and expression patterns before and after branch, e.g. for mouse embryo cells, the mRNA distribution of gene Gata3 is bimodal before branch, unimodal at branching point and trimodal for one branch but bimodal for the other branch. Moreover, there is a distribution mode such that it is the same before and after branch, and this fact would account for maintenance of the genetic information in a complex cell evolving process. Machine learning reveal that along the cell pseudo-time trajectory, the strength that one key gene regulates another is fundamentally increasing before branch but is always monotonically increasing after branch; burst size and frequency of key genes are always monotonically decreasing before branch but monotonically increasing for one branch and monotonically decreasing for another branch. Our results unveil the essential features of dynamic cell processes and can be taken as a supplement for accurately screening marker genes of cell fate determination on basis of the existed methods.
Availability and implementation: The implementation of CFD is available at https://github.com/cellwj/CFD and the preprocessed data is available at https://zenodo.org/records/14367638.Cell fate determination, single-cell RNA sequencing data, marker gene, cell process, developmental branch.
© The Author(s) 2025. Published by Oxford University Press.
Conflict of interest statement
None declared.
Figures


Similar articles
-
Prescription of Controlled Substances: Benefits and Risks.2025 Jul 6. In: StatPearls [Internet]. Treasure Island (FL): StatPearls Publishing; 2025 Jan–. 2025 Jul 6. In: StatPearls [Internet]. Treasure Island (FL): StatPearls Publishing; 2025 Jan–. PMID: 30726003 Free Books & Documents.
-
Short-Term Memory Impairment.2024 Jun 8. In: StatPearls [Internet]. Treasure Island (FL): StatPearls Publishing; 2025 Jan–. 2024 Jun 8. In: StatPearls [Internet]. Treasure Island (FL): StatPearls Publishing; 2025 Jan–. PMID: 31424720 Free Books & Documents.
-
ConvexML: Fast and accurate branch length estimation under irreversible mutation models, illustrated through applications to CRISPR/Cas9-based lineage tracing.Syst Biol. 2025 Aug 8:syaf054. doi: 10.1093/sysbio/syaf054. Online ahead of print. Syst Biol. 2025. PMID: 40795361
-
The Black Book of Psychotropic Dosing and Monitoring.Psychopharmacol Bull. 2024 Jul 8;54(3):8-59. Psychopharmacol Bull. 2024. PMID: 38993656 Free PMC article. Review.
-
A rapid and systematic review of the clinical effectiveness and cost-effectiveness of paclitaxel, docetaxel, gemcitabine and vinorelbine in non-small-cell lung cancer.Health Technol Assess. 2001;5(32):1-195. doi: 10.3310/hta5320. Health Technol Assess. 2001. PMID: 12065068
References
-
- Battich N, Beumer J, De Barbanson B et al. Sequencing metabolically labeled transcripts in single cells reveals mRNA turnover strategies. Science 2020;367:1151–6. - PubMed
-
- Becht E, McInnes L, Healy J et al. Dimensionality reduction for visualizing single-cell data using UMAP. Nat Biotechnol 2018;37:38–44. - PubMed
-
- Bergen V, Lange M, Peidli S et al. Generalizing RNA velocity to transient cell states through dynamical modeling. Nat Biotechnol 2020;38:1408–14. - PubMed
LinkOut - more resources
Full Text Sources
Miscellaneous
