. 2025 Sep 2;16(1):8181.
doi: 10.1038/s41467-025-63687-6.

Targeting ALDH16A1 mediated thioredoxin lysosomal degradation to enhance ferroptosis susceptibility in SMARCA4-deficient NSCLC

Affiliations

Targeting ALDH16A1 mediated thioredoxin lysosomal degradation to enhance ferroptosis susceptibility in SMARCA4-deficient NSCLC

Guoshu Bi et al. Nat Commun. .

Abstract

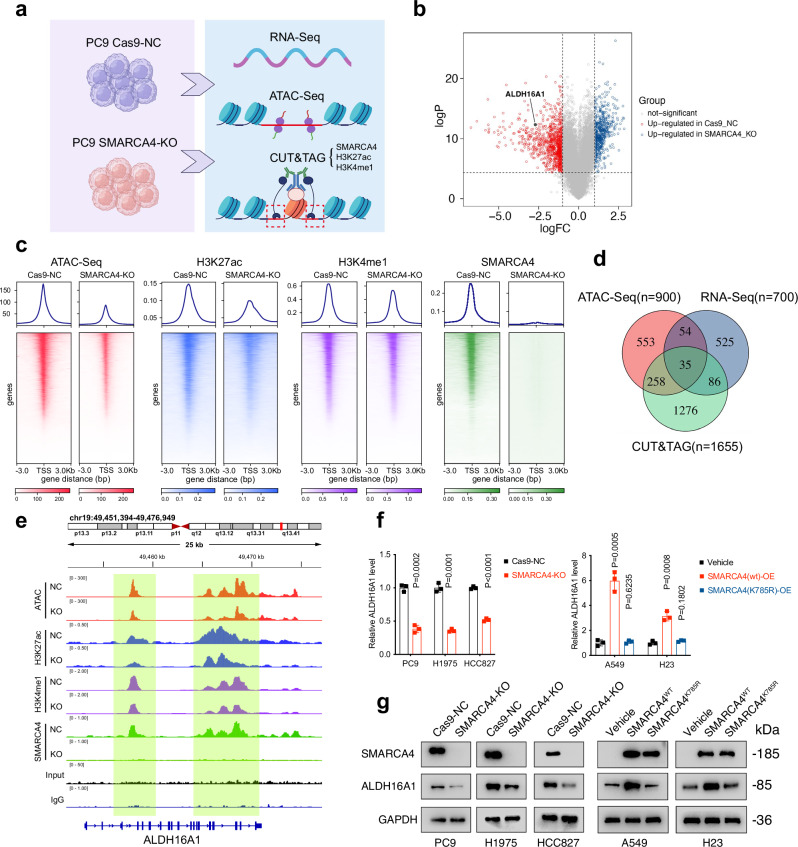
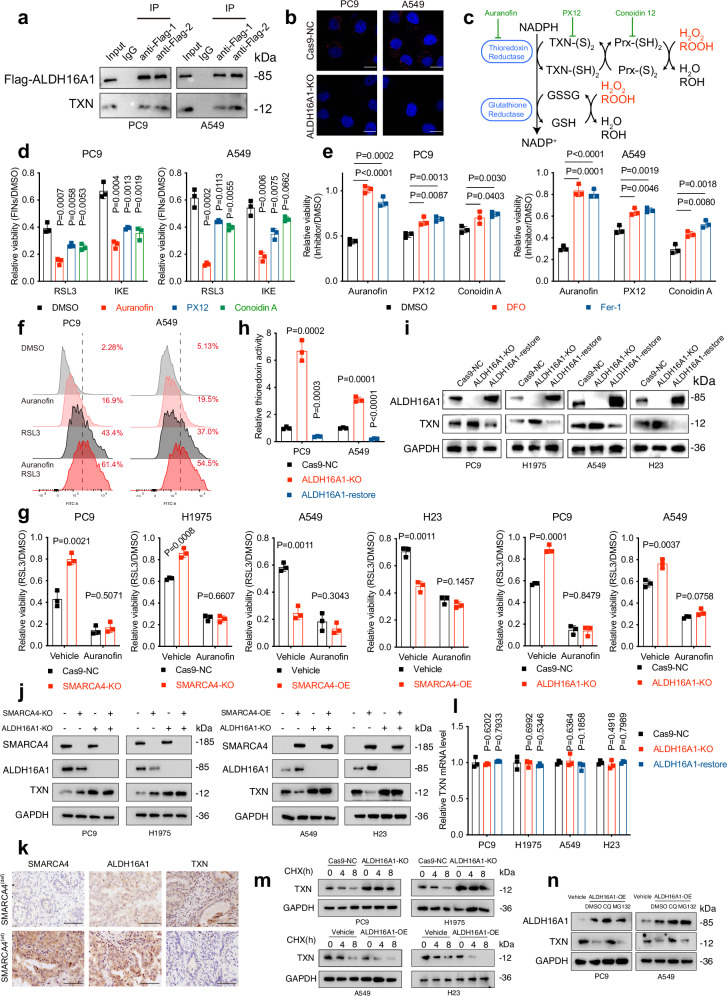
Ferroptosis, an iron-dependent form of cell death, holds promise for cancer therapy. However, the intricate link between ferroptosis and oncogenic mutations remains unclear. Here we show that SMARCA4, a well-established tumour suppressor whose deficiency is associated with poor prognosis and resistance to treatments, sensitizes non-small cell lung cancer (NSCLC) cells to ferroptosis. Mechanistically, SMARCA4 promotes chromatin accessibility and expression of ALDH16A1. Surprisingly, ALDH16A1 lacks ALDH enzymatic activity, but binds to the anti-ferroptotic oxidoreductase thioredoxin (TXN), facilitating its translocation to the lysosome and subsequent degradation. Meanwhile, ALDH16A1 directly inhibits TXN's oxidoreductase function by occluding its active site. We also show that either restoring ALDH16A1 levels or inhibiting TXN significantly enhances the effectiveness of chemo/immunotherapy in a ferroptosis-dependent manner in SMARCA4-deficient NSCLC. Collectively, our findings elucidate an intricate SMARCA4-ALDH16A1-TXN stability/function dual regulatory axis that governs ferroptosis and informs a therapeutic strategy for overcoming resistance to chemotherapy or immunotherapy in SMARCA4-deficient NSCLC.


Conflict of interest statement

Competing interests: The authors declare no competing interests.

Figures

Fig. 1
Fig. 1. CRISPR/Cas9 screening links SMARCA4 to ferroptosis.
a Schematic outline of the CRISPR/Cas9 RSL3 screening workflow in PC9 cell line. Created in BioRender. Bi, G. (2025) https://BioRender.com/fjloxzm. b CRISPR/Cas9 screening results of several genes of interests and well-established ferroptosis regulators. c SMARCA4 protein levels in PC9, H1975, HCC827, A549 and H23 NSCLC cell lines determined by western blotting. d SMARCA4 protein levels in Cas9-NC and SMARCA4-KO PC9, H1975, HCC827 cells determined by western blotting. e Cell viability in Cas-NC and SMARCA4-KO PC9, H1975 and HCC827 cells treated with RSL3 for 6 h. f SMARCA4 protein levels in A549 and H23 cells with indicated genotypes determined by western blotting. g Cell viability in A549 and H23 with indicated genotypes treated with 1000 nM RSL3 for 6 h. h Cell viability in A549 and H23 cells with indicated genotypes treated with 1000 nM RSL3 combined with or without DFO (100 μM), Fer-1 (10 μM), z-VAD-FMK (10 μM), or necrosulfonamide (0.5 μM) for 6 h. i Lipid peroxidation in PC9 and A549 cells with indicated genotypes treated with RSL3 (PC9: 200 nM; A549: 1000 nM) for 3 h. j Transmission electron microscopy images of A549 cells with indicated genotypes treated with 1000 nM RSL3 for 4 h. Scale bars: 4 μm. k Representative brightfield images of patient-derived organoids treated with 10 μM RSL3 for 96 h. Scale bars: 100 μm. Data are presented as the mean ± SD, n = 3 independent experiments. Consistent results were observed across three biological replicates in (c, d, f, j, k). Unpaired two-tailed Student’s t-tests are used. Source data are provided as a Source Data file.
Fig. 2
Fig. 2. SMARCA4 regulates ALDH16A1’s chromatin accessibility and expression.
a Schematic outline of the identification of SMARCA4’s downstream targets using ATAC-Seq, CUT&TAG and RNA-Seq in Cas9-NC and SMARCA4-KO PC9 cells. Created in BioRender. Bi, G. (2025) https://BioRender.com/fjloxzm. b Volcano plots showing the differentially expressed genes between Cas9-NC and SMARCA4-KO PC9 cells. c Heatmap for SMARCA4, H3K27ac, H3K4me1 (CUT&TAG) levels and ATAC-Seq chromatin accessibility in Cas9-NC and SMARCA4-KO PC9 cells across merged SMARCA4 sites. d Venn diagram showing the intersection of potential SMARCA4 targets identified by ATAC-Seq, CUT&TAG and RNA-Seq. e Representative browser track of ATAC-Seq and SMARCA4 (CUT&TAG) on the ALDH16A1 locus in indicated PC9 cells. f, g mRNA (f) and protein (g) levels of ALDH16A1 in PC9, H1975, HCC827, A549 and H23 cells with indicated genotypes, determined by qPCR and western blotting. Data are presented as the mean ± SD, n = 3 independent experiments. Consistent results were observed across three biological replicates in (g). Unpaired two-tailed Student’s t tests are used. Source data are provided as a Source Data file.
Fig. 3
Fig. 3. ALDH16A1 mediates SMARCA4’s pro-ferroptosis property.
a Protein levels of ALDH16A1 in PC9, H1975, A549 and H23 cells with indicated genotypes. b Cell viability in PC9, H1975, A549 and H23 cells with indicated genotypes treated with RSL3 for 6 h. c Lipid peroxidation in PC9 and A549 cells with indicated genotypes treated with RSL3 (PC9: 200 nM; A549: 1000 nM) for 3 h. d Cell viability in Vehicle and ALDH16A1-OE PC9 and A549 cells treated with RSL3 (PC9: 200 nM; A549: 1000 nM) combined with or without DFO (100 μM), Fer-1 (10 μM), z-VAD-FMK (10 μM), or necrosulfonamide (0.5 μM) for 6 h. e Protein levels of SMARCA4 and ALDH16A1 in PC9, H1975, A549 and H23 cell lines with indicated genotypes determined by western blotting. f Cell viability in PC9, H1975, A549 and H23 cells with indicated genotypes treated with RSL3 (PC9: 200 nM; H1975, A549 and H23: 1000 nM) for 6 h. Data are presented as the mean ± SD, n = 3 independent experiments. Consistent results were observed across three biological replicates in (a, e). Unpaired two-tailed Student’s t tests are used. Source data are provided as a Source Data file.
Fig. 4
Fig. 4. ALDH16A1 interacts with ferroptosis suppressor TXN.
a Flag and TXN proteins immunoprecipitated with Flag-ALDH16A1 and total lysates used for immunoprecipitation (IP). b Representative images of PLA signals between endogenous ALDH16A1 and TXN in PC9 and A549 cells, as detected by Duolink PLA assay. Scale bars: 5 μm. c Schematic depiction of TXN-based antioxidative system. d Cell viability in PC9 and A549 cells treated with RSL3 for 6 h or IKE (PC9: 2 μM; A549: 40 μM) for 24 h following pre-treatment with 1 μM auranofin, PX-12, or conoidin A for 6 h. e Cell viability in PC9 and A549 cells treated with 10 μM auranofin, PX-12, or conoidin A combined with or without DFO (100 μM) or Fer-1 (10 μM) for 24 h. f Lipid peroxidation in PC9 and A549 cells treated with RSL3 for 3 h following pre-treatment with 1 μM auranofin for 6 h. g Cell viability in PC9, H1975, A549 and H23 cells with indicated genotypes treated with RSL3 for 6 h following pre-treatment with auranofin for 6 h. h Relative TXN activity in PC9 and A549 cells with indicated genotypes determined by fluorometric assay. i ALDH16A1 and TXN protein levels in PC9, H1975, A549 and H23 cells with indicated genotypes. j SMARCA4, ALDH16A1 and TXN protein levels in PC9, H1975, A549 and H23 cells with indicated genotypes. k SMARCA4, ALDH16A1 and TXN protein levels in SMARCA4 (wt) and deficient NSCLC tumour tissues determined by immunohistochemistry (Scale bars: 100 μm, n = 37). l mRNA levels of TXN in PC9, H1975, A549 and H23 cells with indicated genotypes. m TXN protein levels in PC9, H1975, A549 and H23 cells with indicated genotypes treated with 100 μg/mL CHX for 0, 4 or 8 h. n TXN protein levels in PC9, H1975, A549 and H23 cells with indicated genotypes treated with 100 μg/mL CHX combined with or without 10 μM CQ or MG132 for 8 h. CQ, chloroquine. Data are presented as the mean ± SD, n = 3 independent experiments. Consistent results were observed across three biological replicates in (a, b, i, j, k, m, n). Unpaired two-tailed Student’s t tests are used. Source data are provided as a Source Data file.
Fig. 5
Fig. 5. ALDH16A1 simultaneously impairs TXN’s protein stability and function.
a Immunofluorescence showing the colocalization of TXN (green) with lysosome (marked by LAMP1, red) in PC9 and A549 cells with ALDH16A1-KO or restoration. Scale bars: 10 μm. b Immunofluorescence showing the distribution of TXN and ALDH16A1 (green) in lysosome (marked by LAMP1, red). Scale bars: 10 μm. c TXN protein levels in PC9 and A549 cells. d Immunofluorescence showing the colocalization of TXN (green) with lysosome (red) in PC9 and A549 cells with indicated genotypes. Scale bars: 10 μm. e Cell viability in PC9 and A549 cells with indicated genotypes treated with RSL3 for 6 h. f The structure of ALDH16A1-TXN complex predicted by AlphaFold2. ALDH16A1 N-terminal (1–494aa): cyan; ALDH16A1 C-terminal (525–802aa): blue; TXN: orange. The active site Cys32-Cys35 in TXN sequence and predicted interacting sites are labelled. g Flag and HA-TXN proteins immunoprecipitated with Flag-ALDH16A1 (full-length, 1–494aa, or 525–802aa) or HA-TXN and total lysates used for immunoprecipitation (IP) in HEK-293T cells. h Cell viability in PC9 and A549 cells with indicated genotypes treated with RSL3 for 6 h. i Immunofluorescence showing the colocalization of TXN (green) with lysosome (red) in PC9 and A549 cells with indicated genotypes. Scale bars: 10 μm. j Cell viability in PC9 and A549 cells with indicated genotypes treated with RSL3 for 6 h. k Representative images of PLA signals between edited ALDH16A1 and endogenous TXN in PC9 and A549 cells, as detected by Duolink PLA assay. Scale bars: 5 μm. l Immunofluorescence showing the colocalization of TXN (green) with lysosome (red) in PC9 and A549 cells with indicated genotypes. Scale bars: 10 μm. m Cell viability in PC9 and A549 cells with indicated genotypes treated with RSL3 for 6 h following pre-treatment with 10 μM Chloroquine for 8 h. n Relative TXN activity in PC9 and A549 cells with indicated genotypes treated with 10 μM CQ for 8 h, determined by fluorometric assay. Data are presented as the mean ± SD, n = 3 independent experiments. Consistent results were observed across three biological replicates in (a–d, g, i, k, l). Unpaired two-tailed Student’s t tests are used. Source data are provided as a Source Data file.
Fig. 6
Fig. 6. SMARCA4-ALDH16A1-TXN axis promotes ferroptosis in vivo and enhanced immunotherapeutic efficacy.
a Correlation between expression levels of ALDH16A1 and immunotherapeutic response in melanoma (GSE91061). Chi-square test is performed. b, c Experimental design for co-culture of OVA+ and Luc+ expressing LLC and activated OT-1 cells (b). Created in BioRender. Bi, G. (2025) https://BioRender.com/fjloxzm. The viability of treated LLC is measured using CCK8 after 24 h co-culture with OT-1 cells (c). d–f Experimental design of the A549 mice xenograft assay. Groups of mice were treated as indicated (n = 5 per group) (d). The image (e) and the final weight (f) of resected tumours from A549 mice xenografts, and the growth of tumour volumes were also shown (g). h Representative immunohistochemical images of the resected tumours in each group. Scale bars: 100 μm). Consistent results were observed across three biological replicates. i–l Experimental design of the LLC mice xenograft assay. Groups of mice were treated as indicated (n = 5 per group) (i). The image (j) and the final weight (k) of resected tumours from A549 mice xenografts, and the growth of tumour volumes were also shown (l). m Dot plots of the tumour-infiltrating lymphocytes from a representative mouse in each group. The percentages of CD45+CD8+ T cells and CD45+CD4+ T cells were measured by flow cytometry. Data are presented as the mean ± SD, n = 3 independent experiments unless otherwise stated. Unpaired two-tailed Student’s t tests are used. Source data are provided as a Source Data file.
Fig. 7
Fig. 7. A schematic model depicting the SMARCA4-ALDH16A1-TXN stability/function-ferroptosis axis.
In this work, we identify SMARCA4 as a ferroptosis-promoting tumour suppressor gene. Its direct transcriptional target, ALDH16A1, interacts with TXN, promoting its lysosomal degradation and inhibiting its oxidoreductase function, thereby mediating SMARCA4’s pro-ferroptosis property. Created in BioRender. Bi, G. (2025) https://BioRender.com/fjloxzm.

Similar articles

References

    1. Dixon, S. J. et al. Ferroptosis: an iron-dependent form of nonapoptotic cell death. Cell149, 1060–1072 (2012). - PMC - PubMed
    1. Lei, G., Zhuang, L. & Gan, B. The roles of ferroptosis in cancer: tumor suppression, tumor microenvironment, and therapeutic interventions. Cancer Cell.42, 513–534 (2024). - PubMed
    1. Lei, G., Zhuang, L. & Gan, B. Targeting ferroptosis as a vulnerability in cancer. Nat. Rev. Cancer. 22, 381–396 (2022). - PMC - PubMed
    1. Stockwell, B. R. et al. Ferroptosis: a regulated cell death nexus linking metabolism, redox biology, and disease. Cell171, 273–285 (2017). - PMC - PubMed
    1. Sun, X. et al. Activation of the p62-Keap1-NRF2 pathway protects against ferroptosis in hepatocellular carcinoma cells. Hepatology63, 173–184 (2016). - PMC - PubMed

MeSH terms