. 2025 Sep 2;15(1):32351.
doi: 10.1038/s41598-025-17316-3.

Displacement-encoded MRI reveals biomechanical stiffening in rheumatoid arthritis wrists: a case control study

Affiliations

Displacement-encoded MRI reveals biomechanical stiffening in rheumatoid arthritis wrists: a case control study

Hongtian Zhu et al. Sci Rep. .

Abstract

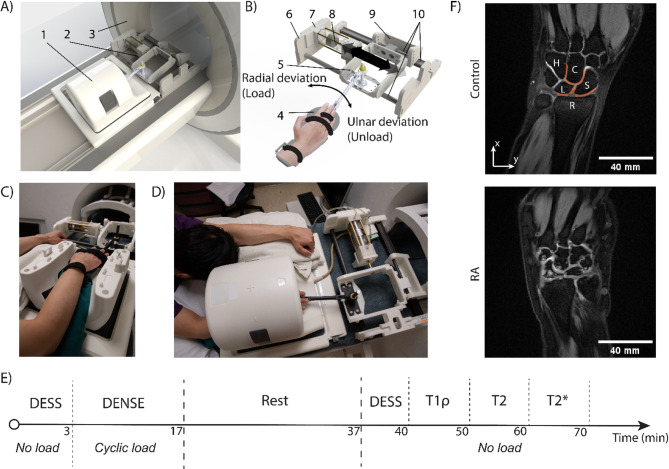
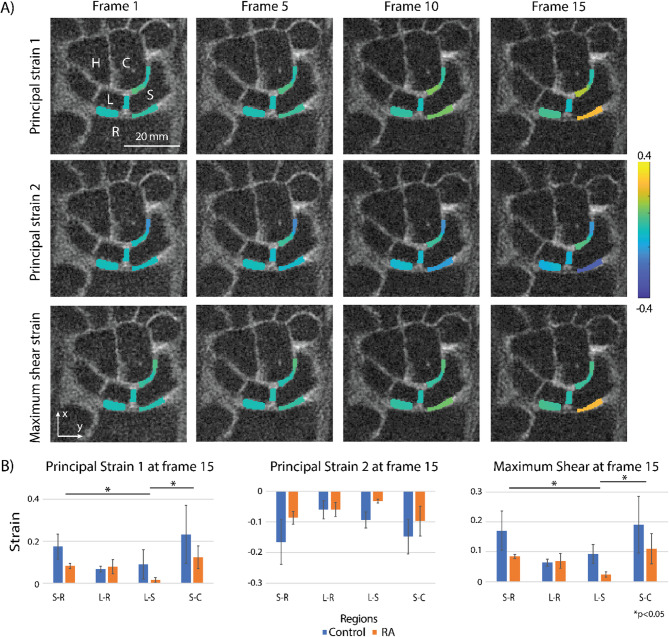
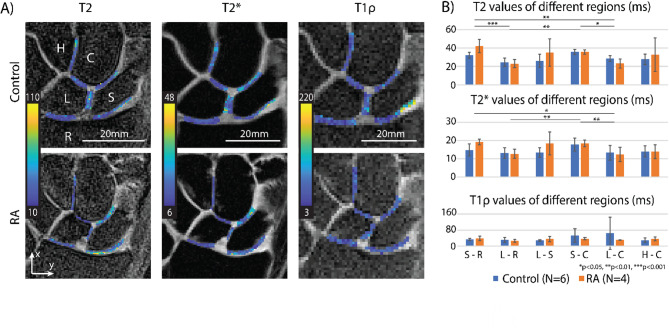
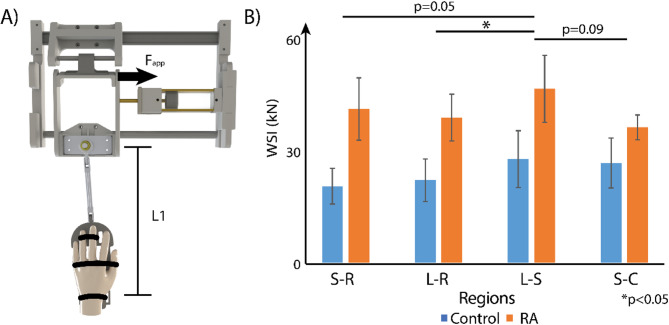
Identifying and diagnosing early-stage rheumatoid arthritis (RA) has remained an unmet challenge in medicine and a roadblock to identifying treatments at time points when disease-modifying therapies may be most effective. Recent studies have demonstrated that imaging the response of cartilage under mechanical loading, as well as alterations in matrix macro- and micro-molecule composition, could serve as potential biomarkers to identify tissue degeneration. Therefore, the objective of this paper was to identify RA-related cartilage degeneration in human wrists using novel MRI techniques. We applied in vivo displacement-encoded MRI to human wrists during cyclic radioulnar deviation, along with the quantitative MRI methods (T1ρ, T2, T2*) during a static condition, to a small healthy and RA patient cohort (6 healthy, 4 RA). We then used a linear mixed-effects model to identify key factors affecting the results. We found that the RA patients had wrists with higher torsional stiffness by approximately 2-fold compared to the control group. The RA group showed lower intercarpal joint displacements by roughly half of the control group, and some joint regions indicated tissue softening. We also found that the quantitative MRI metrics showed non-significant differences between control and RA groups (the T2 and T2* of the RA group was roughly 10% and 5% more than the control group, respectively), however, differences were detected among regions in T2 and T2* metrics. This study demonstrated that displacement-encoded MRI may be a promising method to distinguish functional and noninvasive metrics between RA and healthy wrists, and may provide a means to distinguish the disease state compared to conventional imaging methods.

Keywords: Cartilage; Cartilage degeneration; Wrist; dualMRI; qMRI.


Conflict of interest statement

Declarations. Competing interests: The authors declare no competing interests. Ethics approval and consent to participate: This study was approved by the Institutional Review Board at the University of Colorado, Anschutz.

Figures

Fig. 1
Fig. 1
Experimental set-up, procedure, and example DESS images. A) Computer aided design rendering of a (1) 15-channel knee coil and the (2) loading apparatus mounted on a (3) 3 T MRI scanner. B) The loading apparatus consists of (4) a hand wrap to fix the hand on the device, (5) the moving structure which translates during radial-ulnar deviation, (6) mainframe, (7) cylinder mount, (8) pneumatic cylinder, (9) rear support of the moving structure, and (10) a set of linear bearing system. Nylon fasteners are used to connect different parts. C, D) Photos of the corresponding computer aided design renderings demonstrate the patient positioned in prone position within the MRI scanner with the loading device. E) Time sequence of the MRI scans. The 70 min of scanning time was separated into two sessions with a 20-minute rest in between. F) DESS images depicting wrist and cartilage anatomy of one representative control participant and one RA participant. Here, hamate (H), capitate (C), lunate (L), scaphoid (S), and radius (R) are labeled at their corresponding location on the DESS image, and selected ROIs are in orange shade. The RA patient has pronounced bone edema and irregular carpal bone shapes compared to the control participant. The DESS images are obtained on a 37-year-old male control participant and a 30-year-old female RA participant.
Fig. 2
Fig. 2
DENSE MRI and displacement results on four wrist joint regions: the absolute displacement showed significant differences between regions, and the healthy group had more significantly different region pairs compared to the RA group. (A) Raw DENSE MRI time frame 1 (t = 0ms) and frame 15 (t = 560ms), including magnitude, x-phase, and y-phase images on a 29-year-old female control participant. (B) Displacement map calculated from the phase images on four regions at frame 1, 5, 10, 15. Here, we show the displacements in x and y directions, along with the absolute displacements. All displacements showed a gradual increase over time, where x values increased, and y values decreased, representing radial deviation. (C) Absolute displacement values from frame 1 to frame 15 on both control and RA participant groups showed a gradual increase while the control group had more increase than the RA group. (D) We found regional differences of absolute displacements (S-R vs. L-S, p = 0.0104; L-R vs. L-S, p = 0.0182) and the region pairs that showed significant differences were only in the healthy control group (S-R vs. S-C, p = 0.0040; S-R vs. L-S, p = 0.0114; L-R vs. L-S, p = 0.0371; L-R vs. S-C, p = 0.0135). The difference between control and RA groups was approaching significance with p = 0.0677. Error bars = standard error.
Fig. 3
Fig. 3
Dynamic (time-dependent) principal strains 1, 2, and max shear strain, obtained from DENSE MRI, as well as the averaged strain values of the control and RA patient groups among regions at frame 15. (A) A 29-year-old female control participant’s strain maps show the principal strain 1, 2, and maximum shear strain values change along with frames (1, 5, 10, 15). For this participant, the S-R joint has the maximum averaged strain values, which are 0.26, −0.27, and 0.26 for principal strain 1, principal strain 2, and maximum shear, respectively. (B) Averaged strain values within each region at frame 15. Here, we found regional differences in PS1 and max shear strain (PS1: S-R vs. L-S, p = 0.0255, L-S vs. S-C, p = 0.0236; max shear strain: S-R vs. L-S, p = 0.0237, L-S vs. S-C, p = 0.0255), while no significant differences were found in PS2 metric and between the patient groups. Error bars = standard error.
Fig. 4
Fig. 4
Significant regional differences were found in T2 and T2* values, but no significant differences in T1ρ and between the groups were found. (A) T2, T2*, and T1ρ maps of six regions between carpal bones on one control participant and one RA participant. (B) Statistical analysis of relaxometry results where the plots are mean ± standard error on control and RA participants of the 6 regions. Here, we found regional differences in the T2 and T2* values (T2: S-R vs. L-C, p = 0.0067, S-R vs. L-R, p = 0.0005, L-R vs. S-C, p = 0.0011, S-C vs. L-C, p = 0.0129; T2*: S-R vs. L-C, p = 0.0410, L-R vs. S-C, p = 0.0085, S-C vs. L-C, p = 0.0048). No significant differences found in T1ρ metric and between the patient groups. The relaxometry maps were obtained on a 35-year-old female control participant and a 60-year-old male RA participant.
Fig. 5
Fig. 5
Analysis of a wrist stiffness index (WSI) demonstrated significant regional differences between regions and RA and control patients. (A) To calculate WSI, we measured L1 (341.25 ± 17.50 mm for the RA group, 356.67 ± 9.83 mm for the control group.), recorded Fapp (24.67 ± 5.51 N for the RA group, 25.17 ± 2.40 N for the control group), and then multiplied the two values and divided by absolute displacement, following formula image. (B) The comparison of WSI between control and RA groups, as well as among regions. We found regional differences between L-R and L-S regions (p = 0.0373), while the differences between S-R and L-S (p = 0.0500), L-S and S-C (p = 0.0904) regions were approaching significance. Meanwhile, the differences between control and RA groups were also approaching significance with a p-value of 0.0823.

Similar articles

References

    1. Ilan, D. I. & Rettig, M. E. Rheumatoid arthritis of the wrist. Bull. NYU Hosp. Jt. Dis.61, 179 (2003). - PubMed
    1. Trieb, K. Treatment of the wrist in rheumatoid arthritis. J. Hand Surg. Am.33, 113–123 (2008). - PubMed
    1. Genant, H. K. et al. Assessment of rheumatoid arthritis using a modified scoring method on digitized and original radiographs. Arthritis Rheum.41, 1583–1590 (1998). - PubMed
    1. Leak, R. S., Rayan, G. M. & Arthur, R. E. Longitudinal radiographic analysis of rheumatoid arthritis in the hand and wrist. J. Hand Surg. Am.28, 427–434 (2003). - PubMed
    1. Rainbow, M. J., Wolff, A. L., Crisco, J. J. & Wolfe, S. W. Functional kinematics of the wrist. J. Hand Surg. Eur. Vol. 41, 7–21 (2016). - PubMed

LinkOut - more resources