. 2025 Sep;27(9):1411-1421.
doi: 10.1038/s41556-025-01751-5. Epub 2025 Sep 2.

Genome-wide CRISPR screen identifies Menin and SUZ12 as regulators of human developmental timing

Affiliations

Genome-wide CRISPR screen identifies Menin and SUZ12 as regulators of human developmental timing

Nan Xu et al. Nat Cell Biol. 2025 Sep.

Abstract

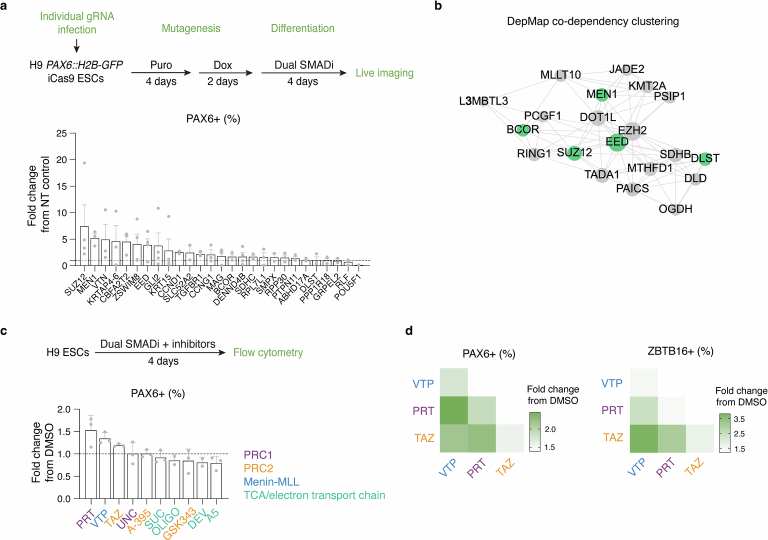
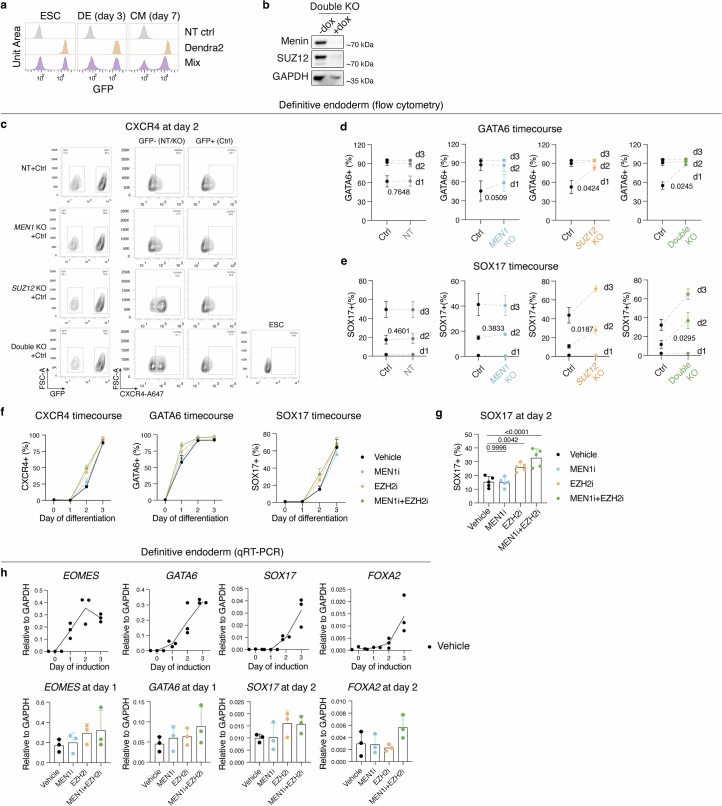
Embryonic development follows a conserved sequence of events across species, yet the pace of development is highly variable and particularly slow in humans. Species-specific developmental timing is largely recapitulated in stem cell models, suggesting a cell-intrinsic clock. Here we use directed differentiation of human embryonic stem cells into neuroectoderm to perform a whole-genome CRISPR-Cas9 knockout screen and show that the epigenetic factors Menin and SUZ12 modulate the speed of PAX6 expression during neural differentiation. Genetic and pharmacological loss-of-function of Menin or SUZ12 accelerate cell fate acquisition by shifting the balance of H3K4me3 and H3K27me3 at bivalent promoters, thereby priming key developmental genes for faster activation upon differentiation. We further reveal a synergistic interaction of Menin and SUZ12 in modulating differentiation speed. The acceleration effects were observed in definitive endoderm, cardiomyocyte and neuronal differentiation paradigms, pointing to chromatin bivalency as a general driver of timing across germ layers and developmental stages.


Conflict of interest statement

Competing interests: L.S. is a scientific cofounder and paid consultant of BlueRock Therapeutics Inc. and a cofounder of DaCapo Brainscience. The remaining authors declare no competing interests.

Figures

Fig. 1
Fig. 1. Genome-wide KO screens identify regulators of human neuroectoderm differentiation speed.
a, Schematic of the neuroectoderm differentiation. NE, neuroectoderm. Dual SMADi, inhibition of SMAD signalling by co-treatment of SB431542 and LDN193189. b, Temporal expression of PAX6 RNA from bulk RNA-seq experiment (left, n = 3 independent differentiations) and quantification of GFP expression in the PAX6::H2B-GFP cell line from flow cytometry analysis (right, n = 4 independent differentiations) during neuroectoderm differentiation. Data are the mean ± s.d. c, Representative histogram plots for live GFP expression in the PAX6::H2B-GFP cell line undergoing neuroectoderm differentiation. d0, day 0 of induction. d, Schematic of the whole-genome CRISPR screen. e, Representative flow cytometry gating strategy to isolate PAX6-GFPhigh and PAX6-GFPlow populations. f, Waterfall plot of the top 100 GSEA enriched pathways from the ranked gene list, ordered by Z-score of PAX6-GFPhigh versus PAX6-GFPlow comparison (top ranks correspond to highly enriched genes in PAX6-GFPhigh population). Chromatin-related and mitochondrial metabolism-related pathways are highlighted in coloured dots. g, Scatter plot of the screen hits (P-value < 0.05; Z-score > 1) highlighted in green dots. P-values were calculated from edgeR’s exact test. Source data
Fig. 2
Fig. 2. Menin or SUZ12 inhibition accelerates expression of neuroectodermal genes.
a,b, PCA plots of the first set of RNA-seq experiment of NT and SUZ12 KO samples (a) and the second set of RNA-seq experiment of NT and MEN1 KO samples (b). Samples are distributed according to their day of differentiation based on top 500 differentially expressed transcript with variance stabilized normalization. c,d, Temporal expression patterns of monotonic up clusters 1 and 4 (c) and monotonic down clusters 7 and 8 (d) in the NT samples identified by TCseq. e,f, Z-score normalized expression of cluster 1 and 4 genes (e) and cluster 7 and 8 genes (f) in MEN1 or SUZ12 KO versus NT control are shown in the line graphs (n, number of genes in each cluster; c,d). Data are the mean ± s.e.m. Normalized counts of selected representative markers of cluster 1 and 4 (c) and cluster 7 and 8 (d) are shown in the bar graphs (n = 3 independent differentiations). Data are the mean ± s.d. P-values were calculated from two-way ANOVA test with post-hoc Tukey’s multiple comparisons test. g,h, GSEA enrichment plots of cluster 1 and 4 genes (g) and cluster 7 and 8 genes (h) in MEN1 or SUZ12 KO versus NT comparisons at day 4. FDR, false discovery rate; NES, normalized enrichment score. Source data
Fig. 3
Fig. 3. Menin and SUZ12 maintain bivalency balance on developmental genes.
a, Pie charts of Menin and SUZ12 peaks in the H9 control hESCs mapped to 3′UTR, 5′UTR, distal intergenic, exon, introns and promoter regions. b,c, Differential analysis for binding of H3K4me3 (b) and H3K27me3 (c) counts. Each dot represents one H3K4me3 or H3K27me3 peak. Peaks that are significantly enriched (red, Padj < 0.05, log2FC > 0) and peaks that are significantly depleted (blue, Padj < 0.05, log2FC < 0) in the KO hESCs, compared to H9 control, are indicated. d, Heatmaps show genomic regions with increased (top panel, each row corresponds to a red dot in b left panel) and decreased (bottom panel, each row corresponds to a blue dot in b left panel) H3K4me3 level in MEN1 KO hESCs compared with control hESCs. NT hESCs were used as control for ATAC-seq, and unmodified H9 hESCs were used as control for CUT&RUN. The genomic regions are ordered according to the H3K4me3 level in the control sample. e, GO analysis on the genes annotated to the peaks with increased H3K4me3 level in MEN1 KO hESCs. Top five GO terms are shown in the dot plot. f, Normalized counts for H3K4me3, H3K27me3 and ATAC peaks for the 265 regions with increased H3K4me3 level in MEN1 KO hESCs. g, Heatmaps show genomic regions with increased (top panel, each row corresponds to a red dot in b right panel) and decreased (bottom panel, each row corresponds to a blue dot in b right panel) H3K4me3 level in SUZ12 KO ESCs compared with control hESCs. The genomic regions are ordered according to the H3K4me3 level in the control sample. h, GO analysis on the genes annotated to the peaks with increased H3K4me3 level in SUZ12 KO hESCs. Top five GO terms are shown in the dot plot. i, Normalized counts for H3K4me3, H3K27me3 and ATAC peaks for the 575 regions with increased H3K4me3 level in SUZ12 KO hESCs. f,i, Box-and-whisker plots: the whiskers represent the minima and maxima, the boxes represent the interquartile range and the centre line represents the median. P values were calculated using two-tailed unpaired t-test comparing KO to control. Source data
Fig. 4
Fig. 4. Loss of Menin or SUZ12 shifts the bivalency balance toward activation at lineage genes.
ac, Average profile plots and example track plots of H3K4me3 and H3K27me3 in control and KO hESCs for ectoderm (a), mesoderm (b) and endoderm (c) lineage markers. For each lineage, the average profile plot of all 23 selected marker genes is shown on the left, with track plots of three representative markers shown on the right. d, Normalized expression of lineage genes in NT and KO hESCs from the RNA-seq. Each dot represents one gene. n = 23 genes for each lineage. Representative genes for each lineage are labelled. P values were calculated using two-tailed paired t-test. Source data
Fig. 5
Fig. 5. Targeting Menin or SUZ12 accelerates differentiations of other lineages and later stages.
a, Schematics of differentiation paradigms. Letters on the arrows indicate the corresponding panels. b, Schematics of differentiation strategy, applicable to c and f, to test the KO effects. Briefly, H9 ESCs carry a fluorescent protein, Dendra2, was mixed in a 1:1 ratio with NT or KO ESCs. DE or CM differentiation was performed on mixed cells. During flow cytometry, Dendra2 control cells are separated from NT or KO cells based on GFP signal, and cellular marker expression was assessed in each population. c, Time course analysis of CXCR4+ cell percentage in control versus NT or KO cells during DE differentiation (n = 3 independent experiments). P-values for day 2 comparisons were calculated using two-tailed paired t-test. d, Quantification of CXCR4+ cell percentage at day 2 (n = 6 independent experiments) and GATA6+ cell percentage at day 1 (n = 5 independent experiments) of DE differentiation with small molecule inhibitor treatment. P values were calculated using one-way ANOVA test with post-hoc Dunnett’s multiple comparisons test. e, Analysis of contraction phenotype during CM differentiation with small molecule inhibitor treatment (n = 3 independent experiments). P-values were calculated using one-way ANOVA test with post-hoc Dunnett’s multiple comparisons test. f, Quantification of SIRPA+ cell percentage at day 7 of CM differentiation in NT and KOs (left, n = 3 independent experiments), and small molecule inhibitors (right, n = 3 independent experiments). P-values were calculated using two-tailed paired t-test (left) and one-way ANOVA test with post-hoc Dunnett’s multiple comparisons test (right). g, Representative images of day 25 cells expressing neuronal markers HuC/D and MAP2. h, Quantification of HuC/D+ cell percentage at day 25 of neurogenesis in NT and KOs (left, n = 3 independent experiments), and small molecule inhibitors (right, n = 3 independent experiments). P-values were calculated using one-way ANOVA test with post-hoc Dunnett’s multiple comparisons test. i, Quantification of SOX2+ cell percentage at day 25 of neurogenesis in NT and KOs (left, n = 3 independent experiments), and small molecule inhibitors (right, n = 3 independent experiments). P-values were calculated using one-way ANOVA test with post-hoc Dunnett’s multiple comparisons test. All data are the mean ± s.d. P-values were indicated on the plots unless not significant (ns, P > 0.05). a created with BioRender.com. Source data
Extended Data Fig. 1
Extended Data Fig. 1. Genome-wide KO screen and analysis.
a, Schematic of PAX6::H2B-GFP iCas9 cell line. iCas9 was inserted at the AAVS1 locus through TALEN-mediated gene targeting in the PAX6::H2B-GFP cell line. TRE, tetracycline response element; M2rtTA, reverse tetracycline transactivator sequence and protein. b, Karyotypic analysis of the PAX6::H2B-GFP iCas9 H9 hESC clonal cell line used for the study. c, Expression of Cas9 RNA in the PAX6::H2B-GFP iCas9 cell line after one day of doxycycline (dox) treatment compared to no dox treatment (n = 3 independent experiments). Data are the mean ± s.d. d, Representative Western Blot analysis for Cas9 protein in the PAX6::H2B-GFP iCas9 cell line (iCas9) after two days of dox treatment compared to no dox treatment. H9 and H9 carrying a constitutive Cas9 expression (H9 Cas9) were used as negative and positive control respectively. e, Flow cytometry analysis of GFP expression during neuroectoderm differentiation in iCas9 cell line and its parental line (n = 4 independent experiments for iCas9 line, n = 3 independent experiments for the parental line). Data are mean ± s.d. f, Workflow of screen analysis. g, Waterfall plots of the top 100 GSEA enriched pathways from the ranked gene list. Chromatin-related and mitochondrial metabolism-related terms are highlighted in separate plots. h, GSEA plots for two of the chromatin-related GO terms, ATAC complex and SET1C/COMPASS complex, that positively correlate with PAX6-GFPhigh population. i, GSEA plot for one of the mitochondrial metabolism-related GO terms, Tricarboxylic acid cycle, that positively correlate with PAX6-GFPhigh population. Source data
Extended Data Fig. 2
Extended Data Fig. 2. Secondary validation experiments of the screen highlight MEN1 and SUZ12 as candidate hits.
a, Schematic of the genetic approach of the secondary validation experiments and the results of PAX6+ (%) at day 4 normalized to NT control (n = 2 independent differentiations for SLC52A2, SMPX, GRPEL2; n = 4 for SUZ12, ZSWIM8, EED, GLI2, KRT15, DENND4B, PPP1R18; n = 3 for the rest). Data are the mean ± s.e.m. b, DepMap analysis on the top ranked hits was performed as described in the ‘DepMap analysis’ method section. Gene cluster that includes the most screen hits was shown. c, Schematic of the pharmacological approach of the secondary validation experiments and the results of PAX6+ (%) at day 4 normalized to NT control (n = 2 for Oligo and Dev; n = 3 for the rest). Small molecule inhibitors are coloured according to their respective targeting pathways. Details on the inhibitors and their doses used can be found in Supplementary Table 3. Data are the mean ± s.e.m. d, Expression of neural markers (PAX6 and ZBTB16) in drug combinations versus DMSO vehicle control at day 4 of neuroectoderm differentiation, assessed by flow cytometry. VTP, VTP50469 (Menin-MLL inhibitor); PRT, PRT4165 (PRC1 inhibitor); TAZ, Tazemetostat (PRC2 inhibitor). Source data
Extended Data Fig. 3
Extended Data Fig. 3. Menin and SUZ12 inhibition largely preserves the broad gene expression patterns.
a, Normalized counts of SUZ12 and MEN1 mRNA in SUZ12 KO and MEN1 KO ESCs used in the RNA-seq. b, Quantification of PAX6+ and ZBTB16+ cell percentage at day 4 of neuroectoderm differentiation with various durations of doxycycline treatment in NT control, assessed by flow cytometry (n = 3 independent experiments). Data are the mean ± s.d. One-way ANOVA test with post-hoc Tukey’s multiple comparisons test. ns, not significant (P > 0.05). c, The combined PCA plot. Samples from both sets of RNA-seq experiments were pooled and analysed together to generate the combined PCA plot, which is then divided into two PCA plots by set (Fig. 2a, b). d, Gene ontology (GO) analysis of monotonic up clusters 1 and 4. Top five GO terms are plotted. e, GO analysis of monotonic down clusters 7 and 8. Top five GO terms are plotted. P values for GO analysis were calculated using Fisher’s exact test and adjusted for multiple comparisons using the Benjamini–Hochberg method. f, Gene clusters of transient expression from TCseq analysis and Z-score normalized expression in MEN1 or SUZ12 KO versus NT. Source data
Extended Data Fig. 4
Extended Data Fig. 4. MEN1 and SUZ12 KO accelerates gene upregulation during neuroectoderm differentiation.
a, Normalized counts of additional representative markers of monotonic up cluster 1 (n = 3 independent differentiations). Data are the mean ± s.d. P values were calculated from two-way ANOVA test with post-hoc Tukey’s multiple comparisons test. b, Time course analysis of mRNA expression of representative markers from monotonic up cluster 1 and 4, relative to housekeeping gene, GAPDH, in NT and KO cells, assessed by qRT-PCR (n = 3 independent experiments). Data are the mean ± s.e.m. P values were calculated from two-way ANOVA test with post-hoc Dunnett’s multiple comparisons test. c, Day 4 expression levels of monotonic up and down genes, grouped by presence or absence of PAX6 binding at the promoter region. A list of PAX6-binding genes in hESCs (N = 3984) was intersected with each cluster; overlapping genes were classified as ‘PAX6 binding’, while the remaining genes were classified as ‘No PAX6 binding’. P values were calculated using two-tailed unpaired t-test. d, Time course analysis of neural markers PAX6, ZBTB16, and MAP2 in the PAX6 KO and its parental control lines during neuroectoderm differentiation (n = 4 for PAX6; n = 2 for ZBTB16 and MAP2), assessed by flow cytometry. Data are the mean ± range for PAX6. Data are the mean for ZBTB16 and MAP2. P values for PAX6 were calculated from two-way ANOVA test with post-hoc Šidák’s multiple comparisons test. e, Schematic of dox-inducible CRISPRa and CRISPRi of PAX6. H9 iCRISPRa or iCRISPRi hESCs were infected with NT or PAX6 gRNA and selected with antibiotics. PAX6 activation or inhibition was induced with 4-day doxycycline treatment (3 days at hESC stage and 1 day during the first day of differentiation). Cells were differentiated into neuroectoderm for 4 days and neural marker expression was assessed by flow cytometry. f, Representative histogram plots for neuroectoderm markers PAX6 and ZBTB16 in the H9 iCRISPRi lines. g, Representative dot plots of one gPAX6i line at day 4. Cell populations were colour-coded based on their PAX6 expression levels. h, Representative histogram plots for neuroectoderm markers PAX6 and ZBTB16 in the H9 iCRISPRa lines. i, mRNA expression of PAX6 relative to housekeeping gene, GAPDH, assessed by qRT-PCR, at day 0. ns, not significant (P > 0.05). Source data
Extended Data Fig. 5
Extended Data Fig. 5. Menin directly binds promoter regions of PRC2 components to regulate their gene expression.
a, Representative Western Blot analysis for Menin and SUZ12 protein in the clonal MEN1 KO and SUZ12 KO cell lines. Two clones for each KO line were used for ATAC-seq. MEN1 KO #1 line and SUZ12 KO #1 line were used for CUT&RUN. b, Representative track plots of H3K27me3 on HOXA and HOXB clusters and average profile plot of all H3K27me3 peaks called in NT control and SUZ12 KO hESCs. c, Venn diagrams show overlap in genes with increased (Padj < 0.05, log2FC > 0) or decreased (Padj < 0.05, log2FC < 0) H3K4me3 between MEN1 KO vs. NT and SUZ12 KO vs. NT comparisons. d, Representative track plots depicting the binding of Menin and MLL1 on EED and EZH2. e, Normalized count of PRC2 components (EZH2, EED, and SUZ12) in NT and MEN1 KO hESCs from the RNA-seq (n = 3 independent differentiations). Data are the mean ± s.d. Source data
Extended Data Fig. 6
Extended Data Fig. 6. Menin and SUZ12 preferentially accelerate expression of bivalent genes during neuroectoderm differentiation.
a,d, Unsupervised clustering of H3K4me3 and H3K27me3 peaks on promoters of genes in monotonic up cluster 1 (a) and cluster 4 (d) identified three chromatin states at hESC stage: bivalent (subcluster_1), high H3K4me3 (subcluster_2), and low H3K4me3 (subcluster_3). b,e, Z-score normalized expression of genes belonging to each chromatin state in cluster 1 (b) and cluster 4 (e) in MEN1 or SUZ12 KO and NT during neuroectoderm differentiation (n = number of genes in each subcluster, indicated on the graphs). Data are the mean ± s.e.m. c,f, Histograms of fold change of gene expression in each chromatin state using normalized count in NT and KOs. Box-and-whisker plots: the whiskers represent the minima and maxima, the boxes represent the interquartile range, and the centre line represents the median (n = number of genes in each subcluster, indicated in b,e). P values were calculated using one-way ANOVA test with post-hoc Tukey’s multiple comparisons test. Source data
Extended Data Fig. 7
Extended Data Fig. 7. Menin and SUZ12 inhibition accelerates DE differentiation.
a, Representative flow cytometry histograms show GFP signals in H9 Dendra2, NT, and mix conditions at ESC, DE, and CM stages. b, Representative Western Blot analysis to confirm the protein loss in the double KO hESCs. c, Representative flow cytometry analysis for CXCR4 expression at day 2 of DE differentiation. Dendra2 control and NT/KO cells were separated by GFP signal, and CXCR4+ gating was established using ESC as the negative control. d, Time course analysis of DE marker GATA6+ cell percentage in control versus NT or KO cells during DE differentiation (n = 3 independent experiments). Data are the mean ± s.e.m. P values for day 1 comparisons were calculated using two-tailed paired t-test. e, Time course analysis of DE marker SOX17+ cell percentage in control versus NT or KO cells during DE differentiation (n = 3 independent experiments). P values for day 2 comparisons were calculated using two-tailed paired t-test. Data are the mean ± s.e.m. f, Time course analysis of DE markers CXCR4 (n = 6 independent experiments), GATA6 (n = 5 independent experiments), and SOX17 (n = 5 independent experiments) with small molecule inhibitors. Data are the mean ± s.d. g, Quantification of SOX17 expression at day 2 with small molecule inhibitors (n = 5 independent experiments). Data are the mean ± s.d. P values were calculated using one-way ANOVA test with post-hoc Dunnett’s multiple comparisons test. ns, not significant (P > 0.05). h, mRNA expression of representative DE markers, relative to housekeeping gene, GAPDH, assessed by qRT-PCR (n = 3 independent differentiations). Upper panels: Time course analysis in the vehicle control cells. Data are each replicate with means connected. Bottom panels: Quantification of DE markers at the onset of gene upregulation following inhibitor treatment. Data are the mean ± s.d. No significant difference among means (P < 0.05) for all markers, tested by one-way ANOVA test with post-hoc Dunnett’s multiple comparisons test. Source data
Extended Data Fig. 8
Extended Data Fig. 8. Menin and SUZ12 inhibition accelerates CM differentiation.
a, mRNA expression of representative CM markers, relative to housekeeping gene, GAPDH, assessed by qRT-PCR (n = 3 independent differentiations). Upper panels, Time course analysis in the vehicle control cells. Data are each replicate with means connected. Bottom panels, Quantification of CM markers at the onset of gene upregulation or downregulation following inhibitor treatment. P values were calculated using one-way ANOVA test with post-hoc Dunnett’s multiple comparisons test. P values were indicated on the plots unless not significant (ns, P > 0.05). b, Quantification of cTnT+ cell percentage at day 7 (n = 2 independent differentiations). c, Representative contour plot and histograms show bimodal distribution of cTnT expression level in day 7 cells, and the gating strategy to define cTnT+ cells. d, Mean fluorescent intensity (MFI) of cTnT in cTnT+ cells in day 7 and 9 cells (n = 2 independent differentiations). Source data
Extended Data Fig. 9
Extended Data Fig. 9. Menin and SUZ12 inhibition accelerates neurogenesis but not mouse neuroectoderm differentiation.
a, Schematic of dox-inducible KO at neuroectoderm stage. b, Representative Western Blot analysis to confirm the protein loss at the NPC (day 20) stage. c, Time course analysis of neuronal marker HuC/D and neural progenitor marker SOX2 with small molecule inhibitors (n = 3 independent experiments). d, Representative images of day 25 cells expressing neural progenitor marker SOX2. e, Quantification of MAP2 expression at day 25 of neurogenesis in small molecule inhibitors (left, n = 3 independent experiments), and NT and KOs (right, n = 3 independent experiments). P values were calculated using one-way ANOVA test with post-hoc Dunnett’s multiple comparisons test. f, Fold change of representative marker expression relative to control in EZH2i versus SUZ12 KO (n = 6 for EZH2i in DE; n = 3 for the rest). P values were calculated using two-tailed unpaired t-test. g, Representative images of H3K27me3 in EZH2i versus SUZ12 KO. h, Fold change of representative marker expression at differentiation endpoint with drug treatment (n = 2 for cTnT; n = 3 for ZBTB16, SOX2, HuCD; n = 4 for PAX6; n = 5 for GATA6, SOX17; n = 6 for CXCR4). i, Quantification of neural markers, Pax6 and Zbtb16, and a pluripotency marker, E-cadherin, during neuroectoderm differentiation of mouse epiblast stem cells (mEpiSCs), assessed by flow cytometry (n = 3 independent differentiations). No significant difference among means (P < 0.05) for all markers, tested by two-way ANOVA test with post-hoc Dunnett’s multiple comparisons test. j, Representative images of day 6 mouse cells expressing the neuroectoderm marker Pax6 and the neuronal marker Map2. White arrows point to Pax6-negative non-neural cells (top panels) and Map2-positive neurons (bottom panels). k, Venn diagrams show overlap in genes with H3K4me3 or MLL1 binding between hESCs and mEpiSCs. ChIP-seq data in mEpiSCs were downloaded from the ChIP-Atlas database. All data are the mean ± s.d. Source data
Extended Data Fig. 10
Extended Data Fig. 10. Gating strategy of live cell flow cytometry.
Single cells are sorted based on FSC-A/SSC-A and FSC-A/FSC-H signal, then live cells are sorted based on DAPI signal.

References

    1. Vassena, R. et al. Waves of early transcriptional activation and pluripotency program initiation during human preimplantation development. Development138, 3699–3709 (2011). - PMC - PubMed
    1. Workman, A. D., Charvet, C. J., Clancy, B., Darlington, R. B. & Finlay, B. L. Modeling transformations of neurodevelopmental sequences across mammalian species. J. Neurosci.33, 7368–7383 (2013). - PMC - PubMed
    1. Otis, E. M. & Brent, R. Equivalent ages in mouse and human embryos. Anat. Rec.120, 33–63 (1954). - PubMed
    1. Miller, D. J. et al. Prolonged myelination in human neocortical evolution. Proc. Natl Acad. Sci. USA109, 16480–16485 (2012). - PMC - PubMed
    1. Marchetto, M. C. et al. Species-specific maturation profiles of human, chimpanzee and bonobo neural cells. eLife8, e37527 (2019). - PMC - PubMed

MeSH terms

LinkOut - more resources