. 2025 Oct;26(10):1766-1780.
doi: 10.1038/s41590-025-02259-8. Epub 2025 Sep 2.

Simultaneous STING and lymphotoxin-β receptor activation induces B cell responses in tertiary lymphoid structures to potentiate antitumor immunity

Affiliations

Simultaneous STING and lymphotoxin-β receptor activation induces B cell responses in tertiary lymphoid structures to potentiate antitumor immunity

Junko Sawada et al. Nat Immunol. 2025 Oct.

Abstract

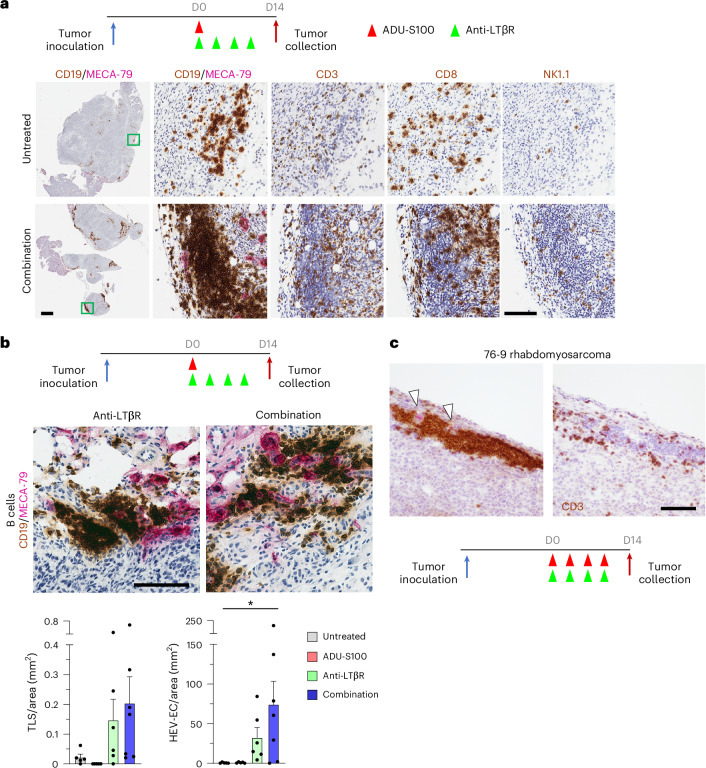
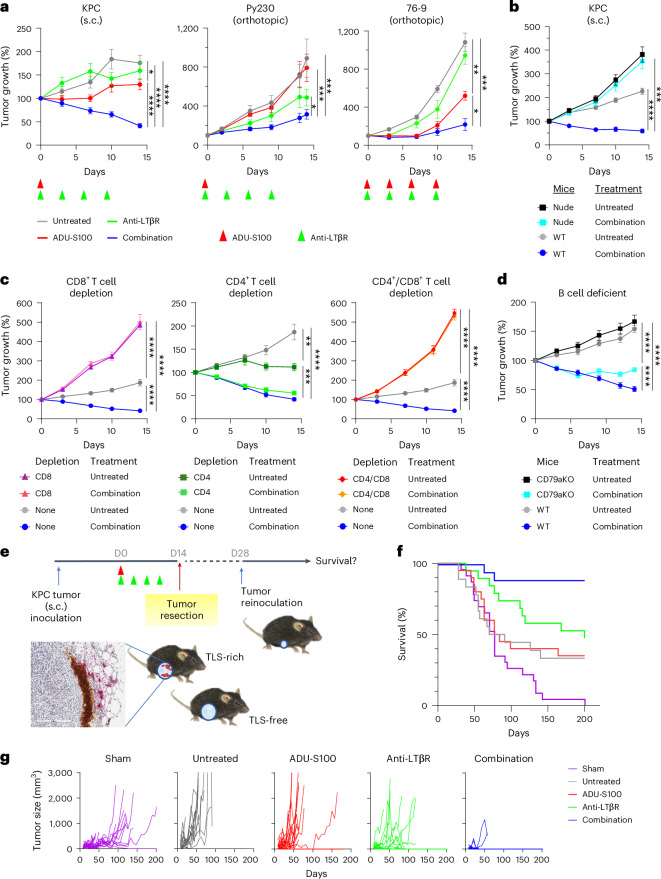
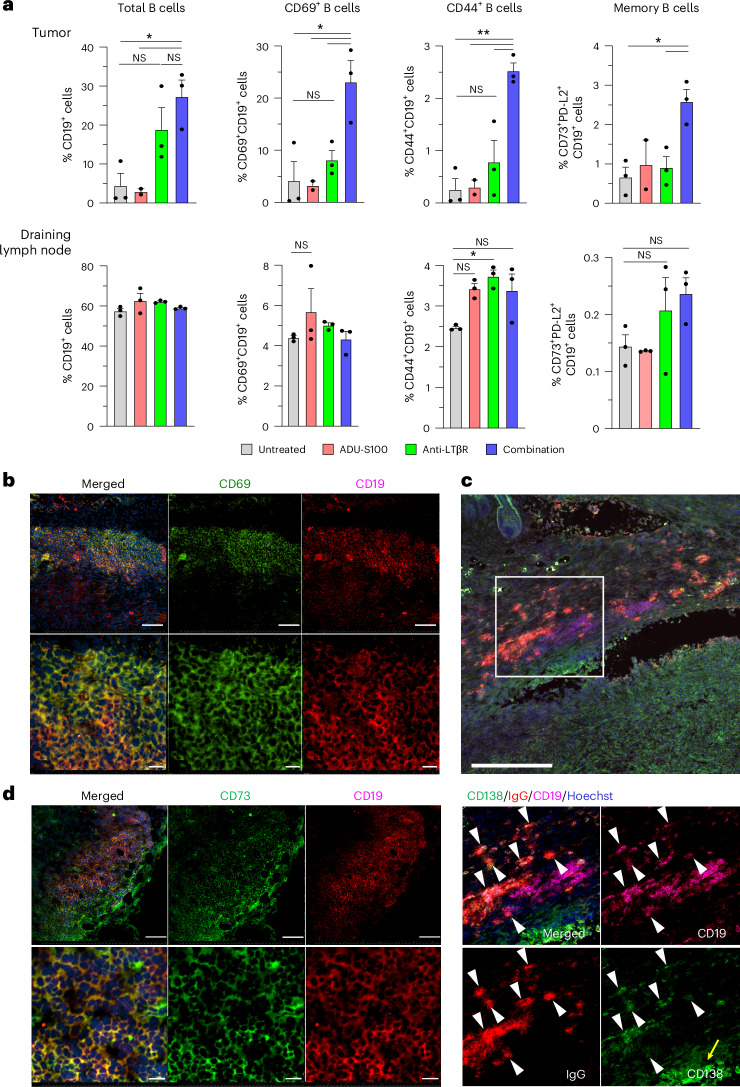
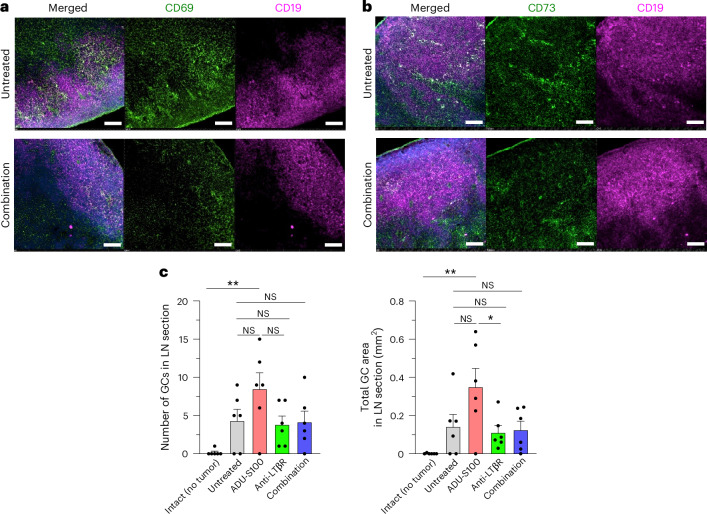
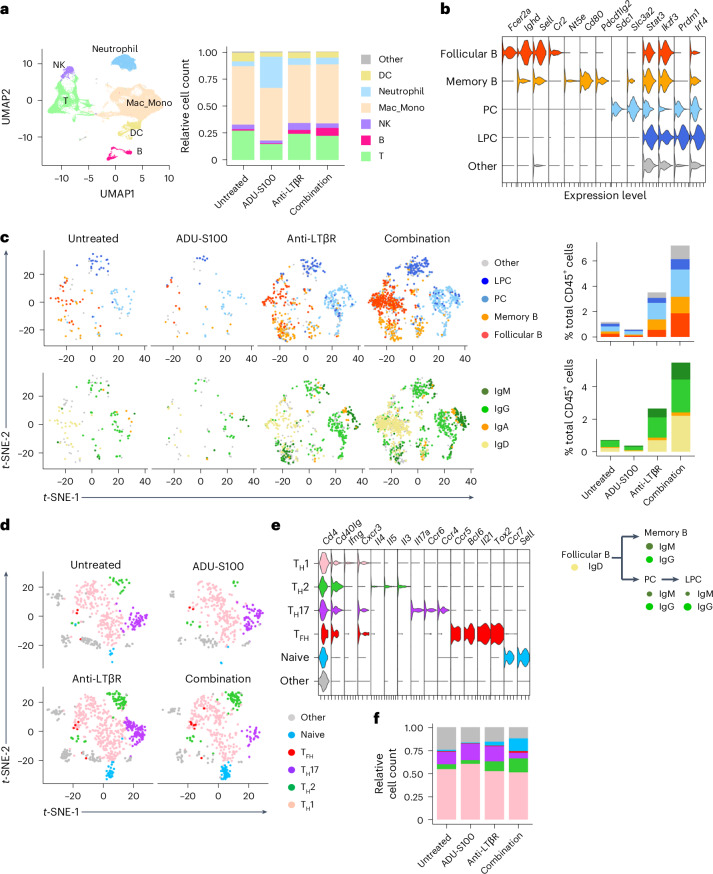
B cell-rich tertiary lymphoid structures (TLS) are associated with favorable prognosis and positive response to immunotherapy in cancer. Here we show that simultaneous activation of innate immune effectors, STING and lymphotoxin-β receptor (LTβR), results in CD8+ T cell-dependent tumor suppression while inducing high endothelial venule development and germinal center-like B cell responses in tumors to generate functional TLS in a T cell-dependent manner. In a neoadjuvant setting, activation of STING and LTβR by their agonists effectively immunized mice against tumor recurrence, leading to long-term survival. STING activation alone was insufficient for inducing B cell-containing TLS or eliciting long-term therapeutic effects. However, when combined with LTβR activation, it improved the fitness of TLS with B cell expansion and maturation to IgG-producing long-lived plasma cells and memory cells, increased CD4+ T cell recruitment and memory CD8+ T cell expansion, and shifted the TH2/TH17 balance, resulting in the potentiation of humoral and cellular immunity against tumors. These findings suggest a therapeutic approach of simultaneously activating STING and lymphotoxin pathways.


Conflict of interest statement

Competing interests: C.F.W. is a co-inventor on patents related to this research (patent no. US 8,974,787). The other authors declare no competing interests.

Figures

Fig. 1
Fig. 1. Drug induction of TLS and HEVs in subcutaneous tumors.
a, STING agonist ADU-S100 (2 μg intratumoral) and/or anti-LTβR agonistic antibody (100 μg, intraperitoneal (i.p.)) were administered to mice bearing subcutaneous KPC tumors as monotherapy or in combination as indicated. Immunohistochemistry of B cells (CD19, brown) and HEVs (MECA-79, magenta) shows numerous TLS induced by combination therapy (day 14). Scale bars, 1 mm (low magnification) and 100 μm (high magnification). b, CD19 and MECA-79 staining of TLS-rich human breast adenocarcinoma for comparison. Scale bars, 1 mm (low magnification) and 100 μm (high magnification). c, KPC tumor sections of different treatment groups were stained for CD19 and MECA-79, scanned for the whole tumor area, and the number of TLS and HEV endothelial cells (HEV-ECs) were quantified per tumor area (mm2) by Halo image analyses. The results of two independent experiments were combined to generate the graphs. A total of N = 17–19 tumors were analyzed. *P < 0.05, ***P < 0.001, ****P < 0.0001. d, Left: immunofluorescence confocal image (z-stack) of TLS induced by combination therapy. Scale bar, 100 μm. Right: the TLS area indicated by the arrow in the left image is shown in higher magnification (three-dimensional confocal image). Scale bar, 10 μm. Nuclear staining of germinal center/follicular cell transcription factor Bcl6 (green) is surrounded by B cell surface marker CD19 (white) or helper T cell marker CD4 (red), indicating germinal center B cells or TFH cells, respectively. Arrows indicate TFH cells found among the dense B cell cluster, demonstrating the intimate interaction between the TFH cell surface (red) and the B cell surface (white). e, Proliferating B cells were detected in TLS by Ki-67 and CD19 double staining. Scale bar, 100 μm. f, Triple immunofluorescence staining of LTβR monotherapy-induced TLS for CD4, CD19 and CD23 (a follicular cell marker) shown in merged and individual color channels. Blue, DAPI. Scale bar, 100 μm. g, Combination therapy on KPC tumors grown in wild-type or T cell-deficient nude mice (C57BL/6 background) demonstrating that neither TLS nor HEVs formed in tumors in the absence of T cells. A representative image of 16 tumors is shown for each genotype. Scale bar, 100 μm. h, CD4+ T cells and/or CD8+ T cells are depleted in wild-type mice by i.p. injection of depleting antibodies one or two days before KPC tumor inoculation as described in Extended Data Fig. 3a. Isotype IgG was injected for the no-depletion control group. Alternatively, KPC tumors were grown in B cell-deficient CD79a knockout mice and treated as shown in a. The development of TLS and HEVs was studied in these mice after combination therapy. A representative image of six tumors is shown for each group. Scale bar, 100 μm. i, The number of TLS and HEV-ECs were quantified per tumor area (mm2). N = 6. P < 0.0001. Representatives of at least three independent experiments are shown in df. Data are presented as the mean ± s.e.m. and analyzed using one-way analysis of variance (ANOVA) with Tukey’s test for statistical significance. All replicates represent biological replicates. NS, not significant.
Fig. 2
Fig. 2. Drug induction of TLS and HEVs in orthotopic tumors.
a, TLS formation in orthotopic KPC tumors in the pancreas. B cells (CD19), T cells (CD3), cytotoxic T cells (CD8) and NK cells (NK1.1) were stained along with HEVs (MECA-79) in serial sections of orthotopic pancreatic tumors 14 days after the start of combination therapy. The areas indicated by the squares in the first images to the far left are shown in high magnification in the images to the right. Representative images of 3–4 tumors are shown. Scale bars, 1 mm (left) and 100 μm (high-magnification images). b, TLS (brown) and HEVs (magenta) formed in orthotopic Py230 mouse mammary tumors upon agonist treatment. Representative images of 6–7 tumors are shown. Graphs show the TLS and HEV-EC densities in tumors of different treatment groups. Stained sections were scanned for the whole tumor area, and the number of TLS and HEVs were quantified per tumor area (mm2) by Halo image analyses. N = 5–7 tumors from 2 independent experiments representing biological replicates. Data are presented as the mean ± s.e.m. and analyzed using one-way ANOVA with Tukey’s test for statistical significance. *P < 0.05. Scale bar, 100 μm. c, Left: TLS formation (brown, CD19) in orthotopic 76-9 rhabdomyosarcoma in the calf muscle. Arrowheads, HEVs (magenta, MECA-79). Right: CD3 staining of a consecutive section. Combination therapy was given four times as indicated. Representative images of ten treated tumors are shown. Scale bar, 100 μm.
Fig. 3
Fig. 3. Therapeutic effects of neoadjuvant agonist combination on tumor growth and survival.
a, Mice bearing different tumor types were treated with STING agonist ADU-S100 (2 μg intratumoral) and/or anti-LTβR agonistic antibody (100 μg, i.p.) as indicated (arrowheads), and the tumor growth curves were monitored until surgical resection. s.c., subcutaneous. N = 22–28 (KPC), N = 11–18 (Py230), N = 5 (76-9) tumors from 2 independent experiments combined, representing biological replicates. *P < 0.05, **P < 0.01, ***P < 0.001, ****P < 0.0001. b, Subcutaneous KPC tumor growth in wild-type (WT) or T cell-deficient nude mice treated or untreated with combination therapy. N = 10 or 12. c, CD4+ T cells and/or CD8+ T cells are depleted in combination therapy-treated and untreated mice by i.p. injection of depletion antibodies one or two days before KPC tumor inoculation (s.c.) as described in Extended Data Fig. 3a. Isotype IgG was injected to the no-depletion control group. Tumor growth was monitored for 14 days. N = 10. d, Subcutaneous KPC tumor growth in WT or B cell-deficient CD79a knockout mice treated or untreated with combination therapy. N = 20. e, Treatment schedule of neoadjuvant agonist therapies for s.c. KPC tumors and tumor resection followed by tumor reinoculation. The primary tumors were either TLS-rich or TLS-free at the time of the resection, depending on the neoadjuvant treatment options. f, Survival curves after tumor reinoculation. Sham control mice had no primary tumors but received tumor inoculation for the first time 2 weeks after sham surgery. N = 18–23. g, Growth curves of reinoculated tumors. For ag, the results of two or more independent experiments were combined and presented in the graphs. Data in ad are presented as the mean ± s.e.m. and analyzed using two-way ANOVA with Tukey’s test for statistical significance. All replicates represent biological replicates. Source data
Fig. 4
Fig. 4. Drug-induced TLS harbor antigen-primed class-switched plasma and memory B cells.
a, Upper bar charts: the abundance of B cells in primary KPC tumors on the day of tumor resection (day 14) determined by flow cytometry. Analyses of total B cells (CD19) as well as CD69 and CD44 expression were conducted to determine early and late activation states of B cells, respectively. The abundance of total and activated B cells is presented as a percentage fraction of the total gated lymphocytes. The fraction of memory B cells was determined by CD73/PD-L2/CD19 triple staining. For each data point, three tumors were pooled and dissociated to isolate lymphocytes for the FACS analysis. A total of 6–9 tumors were examined. Data are presented as the mean ± s.e.m. and analyzed using one-way ANOVA with Tukey’s test for statistical significance. *P < 0.05; **P < 0.01. Lower bar charts: similar analyses of tumor-draining lymph nodes on day 14. For each data point, six draining (inguinal) lymph nodes were pooled for FACS analysis. A total of 18 lymph nodes were examined for each group. A representative of two independent experiments is shown for each analysis. b, CD69 and CD19 immunofluorescence of combination therapy-treated KPC tumors showing that the majority of B cells in TLS are activated. Scale bars, 100 μm (upper images) and 20 μm (lower images). c, Accumulation of IgG-expressing CD138+ plasma cells in TLS (arrowheads). CD138 (syndecan-1) is also expressed by tumor cells (yellow arrow). The TLS area indicated by the square is shown in higher magnification in the lower images. Scale bar, 300 μm. d, CD73+CD19+ B cells are present in TLS. The area of CD73/CD19 doubly stained cells is shown in higher magnification in the lower images. Scale bars, 100 μm (upper images) and 20 μm (lower images). Representatives of at least three independent experiments are shown in bd.
Fig. 5
Fig. 5. Germinal centers of tumor-draining lymph nodes.
Tumor-draining lymph nodes were collected on day 14 and frozen sections examined by immunofluorescence of lymphoid follicles. a, Staining of lymph node follicles of combination therapy-treated and untreated control mouse groups with CD19 (magenta) and CD69 (green) antibodies to assess the activation of follicular B cells in these lymph nodes. Representative sections of six lymph nodes are shown for each group. Scale bars, 100 μm. b, Similarly, staining with CD19 (magenta) and CD73 (green) antibodies to detect memory B cells in the lymph node follicles of combination therapy-treated and untreated control mice. Scale bars, 100 μm. c, Clusters of Ki-67+ B cells within CD19+ B cell follicles were recognized as germinal centers (GCs) by immunostaining of each lymph node section. The number of GCs (left) and the total area of GCs (right) in each lymph node (LN) section are presented in the graphs. Inguinal lymph nodes of mice without tumor implantation were used for intact lymph node control. N = 6, *P < 0.05, **P < 0.01.
Fig. 6
Fig. 6. Tumors exhibit a gene expression signature of enhanced immune responses upon agonist combination therapy.
Bulk RNA-seq was conducted using total RNA isolated from KPC tumors on the day of tumor resection (day 14), and the data were processed by DEseq2. a, Heat map showing differential gene expression between the untreated control and agonist-treated groups. b, Expression levels of genes related to inflammation, innate immunity and adaptive immunity in tumors of different treatment groups. One experiment. N = 8 tumors were examined representing biological replicates for each group. Data are presented as the mean ± s.e.m. c, Gene-set enrichment analysis (GSEA) was performed using the RNA-seq data. Each treatment group was compared to the control group. Normalized enrichment score (NES) for each Gene Ontology term is shown. d, Expression of mouse IgG heavy chain detected in tumors. Eight tumors were examined for each group. In these bulk RNA-seq analyses, individual tumors were sequenced without pooling, and the results from two independent experiments were combined. A total of eight tumors were examined per group. e, Expression of IgG heavy chain detected in TLS-rich and TLS-free human cancer. Pancreatic ductal adenocarcinomas were categorized into TLS-free and TLS-rich tumors, and the expression of class-switched IgG heavy chain was determined by RNA-seq of these tumors. N = 6 tumors from individuals with cancer were examined for each group. f, A similar RNA-seq analysis of IgG expression in human breast adenocarcinomas categorized into TLS-free and TLS-rich tumors. N = 8 individuals with cancer were examined for each group. FDR, false discovery rate.
Fig. 7
Fig. 7. Single-cell RNA-seq analyses of tumor-infiltrating leukocytes.
Tumor-infiltrating CD45+ cells were analyzed on day 14 by single-cell RNA-seq following FACS sorting. a, Left: uniform manifold approximation and projection (UMAP) of different CD45+ leukocyte populations was generated using sets of genes for cell-type annotations as listed in Extended Data Fig. 9. Right: relative abundance of different immune cell types is shown as the fractions of total tumor-infiltrating CD45+ leukocytes in indicated treatment groups. b, Each B cell subtype was identified by expression of indicated marker genes. PC, plasma cell; LPC, long-lived plasma cell. c, Upper plots: the abundance of intratumoral B cell subtypes in different treatment groups. Lower plots: the abundance of intratumoral B cell populations expressing different isotypes of immunoglobulins. df, Intratumoral CD4+ T cell subtypes (naive, TH1, TH2 and TH17) are shown as separate clusters in the t-SNE plots of different treatment groups (d). The identity of each T cell subtype was determined by the expression of indicated marker genes (e). The relative abundance of CD4+ T cell subtypes is shown as the fraction of total intratumoral CD4+ T cells in different treatment groups (f). DC, dendritic cell.
Fig. 8
Fig. 8. Therapeutic effects of neoadjuvant combination therapy are elicited by cellular and humoral immunity.
a, Treatment schedule of neoadjuvant agonist therapies for s.c. KPC tumors and blood plasma collection or serum transfer to naive recipients. b, Blood plasma was collected 2 weeks after tumor resection, heparinized and diluted at a 1:50 ratio with PBS, and added to cultured KPC cells. The binding of plasma IgG to KPC cells was visualized by fluorescently labeled sheep anti-mouse IgG (red). Scale bar, 1 mm. c, Similarly, blood plasma collected from different mouse groups was incubated with KPC cells in single-cell suspension, and the binding of plasma IgG to these cells was detected by the right shift of the cell population in FACS analysis (indicated by red gating). IgM binding was undetectable compared with the sham and intact mouse (non-immune plasma) controls in this assay. d, Percentage fraction of IgG-bound KPC cells in total KPC cells. Plasma samples from 10–14 different mice from each group were examined for KPC cell binding. A representative result of three experiments. **P < 0.01. e, Bone marrow was collected from the left and right femurs and tibias of each agonist-treated or untreated mouse 2 weeks after tumor resection, and bone marrow leukocytes were analyzed by flow cytometry using Blimp1 and CD44 staining as markers for long-lived plasma cells. One experiment. N = 5 per group. *P < 0.05, **P < 0.01, ****P < 0.0001. f, Blood serum was collected from different donor mouse groups (sham surgery, agonist untreated, combination therapy treated) and transferred to naive recipient mice several times after tumor inoculation. The tumor growth in these animals was monitored for 20 days. One experiment. N = 20 tumors were analyzed for each serum transferred group. N = 10 for controls receiving no serum transfer. ***P < 0.001. g, Neoadjuvant treatment and tumor resection followed by tumor reinoculation were carried out in wild-type or B cell-deficient CD79a knockout mice as described in Fig. 3e. Tumor size was compared between different mouse groups on day 9 after tumor reinoculation. The results of two independent experiments were combined. N = 20 tumors were analyzed for each group. ****P < 0.0001. h, Neoadjuvant treatment and tumor resection followed by tumor reinoculation were carried out in wild-type mice as described in Fig. 3e. Starting from one day before the reinoculation of KPC tumors, anti-NK1.1, anti-CD8 or anti-Ly6G was administered (i.p.) to deplete NK cells, CD8+ T cells or neutrophils, respectively. Tumor size was compared between different mouse groups on day 6 after tumor reinoculation. One experiment. N = 20 tumors were analyzed for each group. *P < 0.05, ****P < 0.0001. Data are presented as the mean ± s.e.m. and analyzed using one-way (d, e, g and h) or two-way (f) ANOVA with Tukey’s test for statistical significance. All replicates represent biological replicates. Source data
Extended Data Fig. 1
Extended Data Fig. 1. Pathway analysis based on the differential transcriptome of tumor vascular endothelium in TLS-rich tumors.
A previous transcriptome analysis of human breast adenocarcinoma vasculature identified differentially expressed genes between non-HEV endothelium of TLS-rich vs. TLS-free tumors. a, Volcano plot presentation of differentially expressed genes. The log2 fold change of gene expression in the endothelium of TLS-rich tumors compared with TLS-free tumors is shown on the X-axis. P values are shown on the Y-axis (-log10). The genes with statistically significant differences are shown in red dots. p < 0.05. b, An upstream prediction analysis of these gene sets was performed using the Ingenuity Pathway Analysis (IPA) program. This study identified Type-I IFN, tumor necrosis factor (TNF), Toll-like receptor 7 (TLR7), TLR9, and lymphotoxin-β (LTβ) suggesting inflammation and innate immunity signaling in the tumor microenvironment. Also identified were CXCL13, CD40L, IL21, and IL21R, which regulate B cell recruitment, activation, and differentiation as well as generation/maintenance of follicular helper T (TFH) cells and germinal center development.
Extended Data Fig. 2
Extended Data Fig. 2. Formation of tumor-associated TLS upon agonist treatment.
a, Cryosections of subcutaneous KPC tumors of different treatment groups were stained for CD19. The IHC images were deconvoluted to highlight the positive staining in bright green in low magnification to show whole tumor areas. Scale bar, 1 mm. b, Immunostaining of CD19 and CD3 with MECA-79 to visualize B cells, T cells, and HEVs in TLS areas of KPC tumors treated with LTβR agonist or LTβR/STING agonist combination. c, KPC tumors treated with anti-LTβR monotherapy or combination therapy. Areas of tumor sections containing TLS were stained for a germinal center marker CD21 (brown) and B cell marker CD19 (magenta). d, Left: TLS was stained for CD19 for B cells (brown) and MECA-79 for HEVs (magenta) in LTβR monotherapy-treated KPC tumors. Right: A consecutive tumor section was stained for a germinal center cell marker CD23 (brown). e, Triple immunofluorescence staining of TLS for CD4, CD21, and CD19 in LTβR monotherapy-treated KPC tumors. Blue, Hoechst. Scale bar 100 μm.
Extended Data Fig. 3
Extended Data Fig. 3. Agonist treatment study in T cell-depleted mice and B cell-deficient mice.
a, Treatment schedule for subcutaneous KPC tumors. CD4+ and/or CD8+ T cells were deleted individually or together by i.p. injection of anti-CD4 and/or CD8 IgG (200 μg) every 4 days, starting from one or two days before tumor inoculation as indicated. Isotype IgG2b was injected for the no-depletion control group. b, T cell depletion was confirmed by FACS analysis of peripheral blood lymphocytes. Rat anti-mouse CD4 (clone: GK1.5) and rat anti-mouse CD8α (clone: 2.43) were used to deplete CD4+ and CD8+ T cells, respectively. Rat IgG2b was used as an isotype control (clone: LTF-2). c, Flow cytometry analyses of spleen and peripheral blood leukocytes show the absence of CD19+ B cells in CD79a knockout mice.
Extended Data Fig. 4
Extended Data Fig. 4. Induction of STING signaling by intratumoral ADU-S100.
a, KPC tumor-bearing mice were treated with/without agonist monotherapy or combination therapy, and tumors were harvested at indicated timepoints. Two tumors were pooled and lysed for western blot analysis for each treatment option at each timepoint. The activation of STING pathway was analyzed by phosphorylation of IRF3 and IFNβ expression downstream of STING. A representative western blot of two independent experiments is shown. β-actin was used as a loading control. b, KPC tumors were co-stained for IFNβ with macrophage (F4/80) and endothelial cell (CD31) markers at 4 h post monotherapy or combination therapy to evaluate STING activation in these cells. Immunofluorescence images (top panels) are shown in higher magnification in the middle and/or bottom panels. IFNβ+ macrophages and endothelial cells are indicated by green and red circles, respectively. Scale bar, 100 μm (top panels) and 20 μm (middle and bottom panels). c, ADU-S100 (10 μM) was added to the culture of KPC cells or endothelial cells (HUVEC) for indicated time, and the activation of STING signaling was analyzed by IRF3 Ser385 phosphorylation. The quantification of phosphorylated IRF3 was normalized by total IRF3. β-actin was used as a loading control. d, Leukocytes were isolated from peripheral blood or the peritoneum of normal mice and incubated in vitro with 7.2 μg/ml STING agonist ADU-S100 for 2 h at 37 °C. Phosphorylation of IRF3 in leukocyte subsets (CD11b+ myeloid cells, CD3+ cells, CD19+ cells, and NK1.1+ cells) was detected by α-phospho-IRF3 Ser385 antibody staining. Cells were permeabilized using eBioscience™ Transcription Factor Staining Buffer Set before staining. The percent fraction of phospho-IRF3+ cells in each subset of blood or peritoneal leukocytes was determined by flow cytometry. N = 2 *p < 0.05, **p < 0.01. Source data
Extended Data Fig. 5
Extended Data Fig. 5. Flow cytometry analyses of tumor-infiltrating B cells.
a, KPC tumors were resected on Day 14 of the treatment study, dissociated into single cells in suspension by Liberase digestion, and stained for CD19, CD69, and CD44. Viable lymphocytes were then analyzed by FACS. b, Expression of early activation marker CD69 and late activation marker CD44 in tumor-infiltrating B cells. c, B cells count in tumor and draining lymph node. Upper panels: The number of total CD19+ B cells or activated B cells per tumor was calculated from the total live cell count after tumor dissociation and the % fractions of these B cells as determined by flow cytometry (Fig. 4a). For each data point, three tumors were pooled, and the obtained cell number was divided by three to yield average B cell count/tumor. Total 6-9 tumors were examined. Lower panels: Similarly, the number of B cells in the draining lymph node was calculated from the total lymphocyte count in each lymph node and the % fraction of B cells in them. A representative result of two independent experiments is shown for each analysis. *p < 0.05; ***p < 0.01; **p < 0.001; ns, not significant. d, Total lymphocyte count in a draining lymph node. For each data point, six draining lymph nodes were pooled and averaged.
Extended Data Fig. 6
Extended Data Fig. 6. Analysis of tumor-infiltrating T cells.
a, Upper panels: The abundance of CD8+ T cells in primary KPC tumors on the day of tumor resection (Day 14) determined by flow cytometry. Analyses of total CD8+ T cells as well as CD69 and CD44 expression were conducted to determine early and late activation states of CD8+ T cells, respectively. The abundance of total and activated CD8+ T cells is presented as a % fraction of total CD3+ T cells. For each data point, three tumors were pooled and dissociated to isolate lymphocytes for FACS analysis. Total 6-9 tumors were examined. Lower panels: The number of total CD8+ T cells or activated CD8+ T cells per tumor was calculated from the total live cell count after tumor dissociation and the % fractions of these T cells as determined by flow cytometry (Fig. 4a). For each data point, three tumors were pooled, and the obtained cell number was divided by three to yield average T cell count/tumor. Total 6-9 tumors were examined. b, A similar analysis of tumor-draining CD4+ T cells. A representative result of two independent experiments is shown for each analysis. *p < 0.05; **p < 0.01; ***p < 0.001; ns, not significant.
Extended Data Fig. 7
Extended Data Fig. 7. Analysis of T cells in tumor-draining lymph node.
a, Upper panels: Live lymph node leukocytes were gated for CD3+ T cells, and the % fractions of total and activated CD8+ T cells in total CD3+ T cells were determined by flow cytometry. Lower panels: The numbers of total and activated CD8+ T cells in a draining lymph node were calculated from the total leukocyte count in each lymph node and the % fractions of the T cell subsets. For each data point, six draining lymph nodes were pooled and averaged. A total of 18 lymph nodes were examined for each group. A representative of two independent experiments is shown for each analysis. *p < 0.05; ***p < 0.01; **p < 0.001; ns, not significant. b, A similar analysis of CD4+ T cells in the draining lymph node. Upper panels: The % fractions of total and activated CD4+ T cells in total CD3+ T cells. Lower panels: The average numbers of total and activated CD4+ T cells in a draining lymph node.
Extended Data Fig. 8
Extended Data Fig. 8. Gene expression signature of enhanced immune responses upon combination therapy.
Bulk RNAseq was conducted using total RNA isolated from KPC tumors on the day of tumor resection (Day 14), and the data was processed by DEseq2. The graphs show the expression of different genes related to inflammation, innate immunity, and adaptive immunity in tumors of different treatment groups. One experiment. N = 8 tumors were examined representing biological replicates for each group. Data are presented as the mean ± s.e.m.
Extended Data Fig. 9
Extended Data Fig. 9. Gene expression patterns used to identify immune cell types in single-cell analysis.
a, The immune cell types identified in the UMAP clusters shown in Fig. 7 were determined based on the signature gene expression for each cell type. The genes listed here were found among the top 20 genes in each cluster using FindMarkers function of the Seurat application. b, Single-cell analysis of B cell subsets. Feature plots with module score for B cell subsets generated from the single-cell RNAseq analysis of tumor-infiltrating CD45+ cells on Day 14. Each B cell subset (follicular B, memory B, plasma cell, or long-lived plasma cell) was identified according to indicated marker genes. PC, plasma cell.
Extended Data Fig. 10
Extended Data Fig. 10. Single-cell RNAseq analysis of tumor infiltrating T cells.
a, Left, Subclusters of intratumoral CD3+ T cells are compared between the treatment groups. T cell subsets are identified in these clusters. Right, Relative abundance of T cell subsets is shown as the fractions of total CD3+ T cells. b, CD8+ T cell population was further subclustered to identify subsets of CD8+ T cells infiltrating the tumors. c, Subsets of CD8+ T cells were identified by the expression of indicated marker genes. Tmem, memory CD8+ T cell; Tex_prog, progenitor exhausted CD8+ T cell; Tex_term, terminally exhausted CD8+ T cell. d, Relative abundance of different CD8+ T cell subsets in total CD8+ T cells. Memory CD8+ T cell population (green) expanded in treatment groups, especially in LTβR monotherapy and combination therapy groups, compared with the untreated group.

References

    1. Martinet, L. et al. Human solid tumors contain high endothelial venules: association with T- and B-lymphocyte infiltration and favorable prognosis in breast cancer. Cancer Res.71, 5678–5687 (2011). - PubMed
    1. Martinet, L., Garrido, I. & Girard, J. P. Tumor high endothelial venules (HEVs) predict lymphocyte infiltration and favorable prognosis in breast cancer. Oncoimmunology1, 789–790 (2012). - PMC - PubMed
    1. Martinet, L. et al. High endothelial venules (HEVs) in human melanoma lesions: major gateways for tumor-infiltrating lymphocytes. Oncoimmunology1, 829–839 (2012). - PMC - PubMed
    1. Schumacher, T. N. & Thommen, D. S. Tertiary lymphoid structures in cancer. Science375, eabf9419 (2022). - PubMed
    1. Hiraoka, N. et al. Intratumoral tertiary lymphoid organ is a favourable prognosticator in patients with pancreatic cancer. Br. J. Cancer112, 1782–1790 (2015). - PMC - PubMed

LinkOut - more resources