

Seed phenotype and maturity groups as determinants of protein, oil, and fatty acid composition patterns in diverse soybean germplasm
- PMID: 40898029
- PMCID: PMC12403403
- DOI: 10.1186/s12870-025-07182-6
Seed phenotype and maturity groups as determinants of protein, oil, and fatty acid composition patterns in diverse soybean germplasm
Abstract
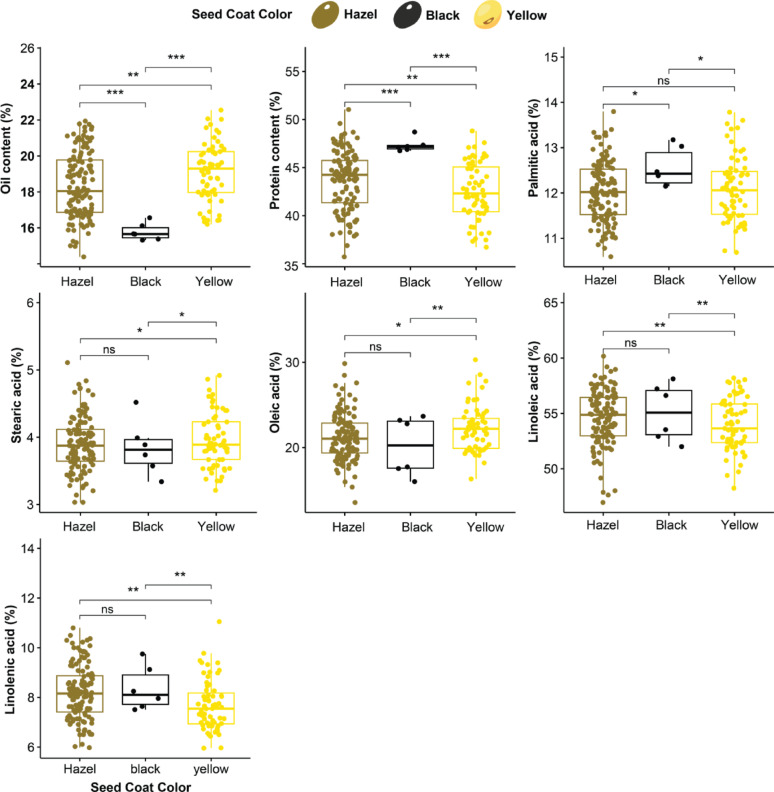
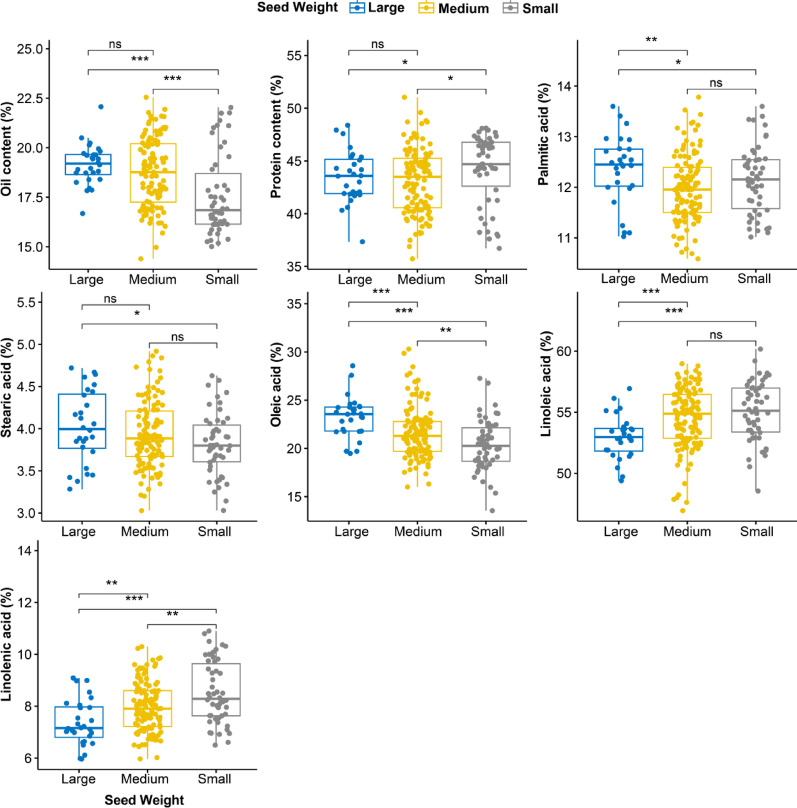
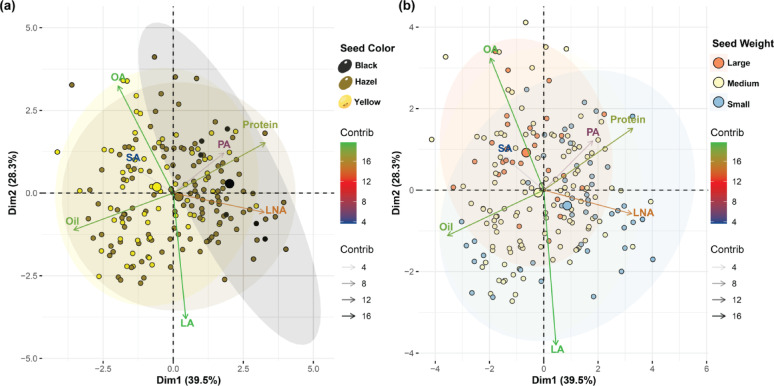
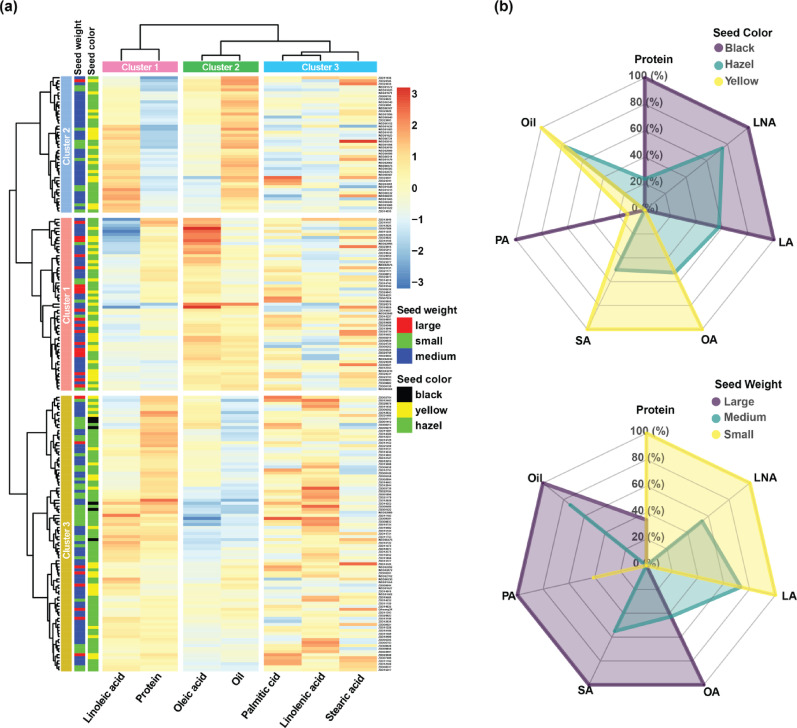
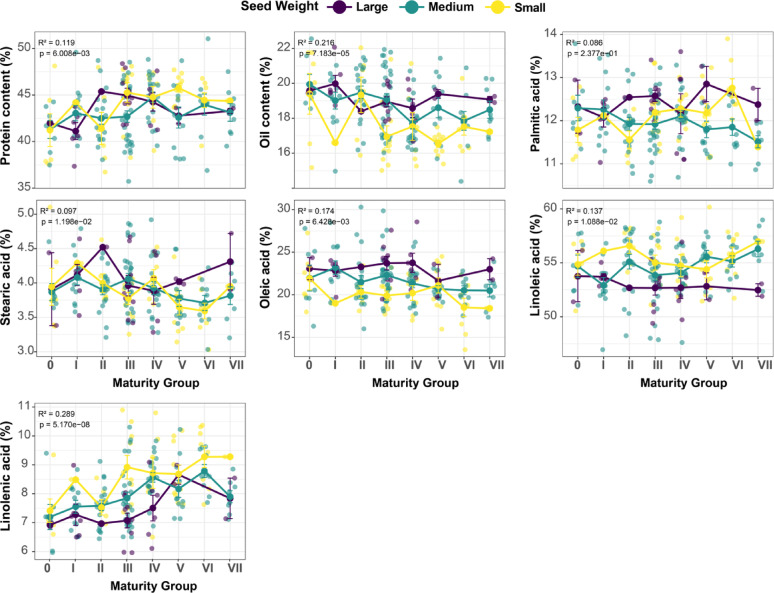
Soybean seed physical characteristics are crucial for quality assessment, but the link between these characteristics and biochemical composition across different maturity groups (MGs) remains unclear. This study examined the relationships between seed physical characteristics (color and weight) and biochemical constituents, including oil content (OC), protein content (PC), and fatty acid (FA) composition in 191 diverse soybean accessions across eight MGs (0-VII) at three locations over two years. The results indicated that black-seeded accessions demonstrated a notably higher average of PC (47.33%) and a lower average of OC (15.78%) in contrast to yellow-seeded varieties, which had an average PC and OC of 42.52% and 19.12%, respectively. In addition, larger seeds exhibited increased OC (19.15%) and OA levels (23.27%), whereas smaller seeds revealed higher concentrations of PC (44.23%), LA (55.06%), and LNA (8.53%). Multivariate analyses, including principal component analysis, clustering heatmap, and radar plot, demonstrated distinct clustering patterns, exhibiting unique compositional profiles closely linked to seed physical characteristics. Furthermore, MGs exhibited notable correlations with LNA (R² = 0.238) and OC (R² = 0.233), especially in black-seeded and large-seeded accessions. These findings elucidate the complex interaction between seed physical traits and biochemical composition, presenting significant implications for soybean breeding programs aimed at specific quality attributes.
Keywords: Glycine max; Maturity groups; Multivariate analysis; Seed coat color; Seed composition; Seed weight.
© 2025. The Author(s).
Conflict of interest statement
Declarations. Ethics approval and consent to participate: This article does not contain any studies on human or animal subjects. The current experimental research and field study, including the collection of plant material, is complying with relevant institutional, national, and international guidelines and legislation and used for research and development. Consent for publication: Not applicable. Competing interests: The authors declare no competing interests.
Figures


Similar articles
-
High resolution QTL mapping and candidate gene mining for seed oil content and fatty acid composition in soybean.BMC Plant Biol. 2025 Jul 3;25(1):867. doi: 10.1186/s12870-025-06911-1. BMC Plant Biol. 2025. PMID: 40610868 Free PMC article.
-
Phenotypic characteristics of interspecific hybrids between wild and cultivated soybean with and without insect-protected biotechnology traits.Transgenic Res. 2025 May 14;34(1):24. doi: 10.1007/s11248-025-00443-y. Transgenic Res. 2025. PMID: 40369157 Free PMC article.
-
QTL Mapping and Multiomics Identify Candidate Genes for Hundred-Seed Weight in Soybean (Glycine max L.).J Agric Food Chem. 2025 Aug 20;73(33):21175-21185. doi: 10.1021/acs.jafc.5c01715. Epub 2025 Aug 6. J Agric Food Chem. 2025. PMID: 40768674
-
Omega-3 fatty acids for depression in adults.Cochrane Database Syst Rev. 2015 Nov 5;2015(11):CD004692. doi: 10.1002/14651858.CD004692.pub4. Cochrane Database Syst Rev. 2015. Update in: Cochrane Database Syst Rev. 2021 Nov 24;11:CD004692. doi: 10.1002/14651858.CD004692.pub5. PMID: 26537796 Free PMC article. Updated.
-
Chia (Salvia hispanica L.), a functional 'superfood': new insights into its botanical, genetic and nutraceutical characteristics.Ann Bot. 2024 Nov 13;134(5):725-746. doi: 10.1093/aob/mcae123. Ann Bot. 2024. PMID: 39082745 Free PMC article. Review.
References
-
- Abdelghany AM, Zhang S, Azam M, Shaibu AS, Feng Y, Li Y, Tian Y, Hong H, Li B, Sun J. Profiling of seed fatty acid composition in 1025 Chinese soybean accessions from diverse ecoregions. Crop J. 2020;8(4):635–44.
-
- Abdelghany AM, Zhang S, Azam M, Shaibu AS, Feng Y, Qi J, Li Y, Tian Y, Hong H, Li B, Sun J. Natural variation in fatty acid composition of diverse world soybean germplasms grown in China. Agronomy. 2019;10(1):24.
-
- Anderson EJ, Ali ML, Beavis WD, Chen P, Clemente TE, Diers BW, Graef GL, Grassini P, Hyten DL, McHale LK, Nelson RL, Parrott WA, Patil GB, Stupar RM, Tilmon KJ. Soybean [Glycine max (L.) Merr.] breeding: history, improvement, production and future opportunities. Adv Plant Breed Strategies: Legumes. 2019;7:431–516.
MeSH terms
Substances
Grants and funding
LinkOut - more resources
Full Text Sources
