. 2025 Sep 2;26(1):798.
doi: 10.1186/s12864-025-11983-2.

Transcriptome dynamics and allele-specific regulation underlie wheat heterosis at the anthesis and grain-filling stages

Affiliations

Transcriptome dynamics and allele-specific regulation underlie wheat heterosis at the anthesis and grain-filling stages

Xiaojun Wu et al. BMC Genomics. .

Abstract

Background: As wheat is a globally important staple crop, the molecular regulatory network underlying heterosis in wheat remains incompletely understood. The flag leaf is the primary source of photoassimilates during grain filling and plays a crucial role in yield formation. However, the genetic mechanisms linking flag leaf development to heterosis are still unclear.

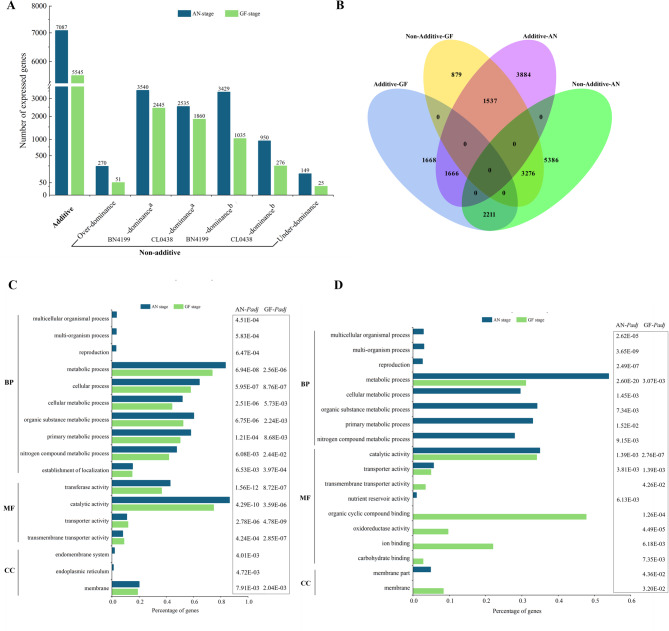
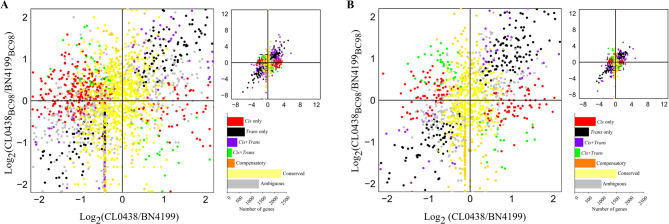
Results: Transcriptomic analysis revealed dynamic transcriptional reprogramming during the anthesis to grain-filling transition, with a pronounced expression bias toward superior parental alleles in hybrids. Anthesis-stage non-additive dominance and grain-filling-stage additive enhancement synergistically orchestrated the temporal regulatory shift underlying heterosis. The dominant alleles from the superior parent accounted for more than 60% of the non-additive genes, and the superior parent bias in allele-specific expression ratios progressively increased during development. This highlighted the role of the superior parent as an allelic reservoir. Cis-regulatory variations primarily contributed to additive effects, whereas cis×trans interactions were the primary regulatory driver of positive overdominance. Notably, weighted co-expression network analysis identified HSP90.2-B as a putative heterosis-related gene, whose coordinated overexpression with AP2/ERF transcription factors provides valuable insights for elucidating the molecular basis of yield heterosis.

Conclusions: This study establishes two complementary models to decode the molecular regulation of heterosis in wheat. The "dual-engine" model demonstrates stage-specific gene expression patterns: non-additive effects predominantly drive early growth vigor during the anthesis stage, whereas additive expression patterns stabilize grain development and yield-related traits at the grain-filling stage. The "two-phase regulatory shift" model captures the dynamic temporal progression of heterotic regulation, evolving from trans-regulation-driven plastic responses at the anthesis stage to cis-regulation-mediated homeostatic control at the grain-filling stage. Importantly, the preferential coupling between cis-regulation/additive and trans-regulation/non-additive expression provides molecular evidence supporting the complementary nature of the models. We further identified developmentally specific modules (the anthesis-stage Red module and grain-filling-stage Brown module) with their core regulatory networks through weighted gene co-expression network analysis. These findings preliminarily characterize the multi-layered cooperative networks regulating heterosis development, potentially offering valuable theoretical clues for deciphering the molecular mechanisms underlying wheat heterosis.

Keywords: Cis- and trans-regulation; HSP90.2-B; Triticum aestivum L.; Additive and non-additive expression patterns; Allele-specific expression; Heterosis; Transcriptome; Weighted gene co-expression network analysis.


Conflict of interest statement

Declarations. Ethics approval and consent to participate: Not applicable. Consent for publication: Not applicable. Competing interests: The authors declare no competing interests.

Figures

Fig. 1
Fig. 1
Phenotypic evaluation of the wheat hybrid BC98 and its parental lines. The plant lines in each figure are displayed in the following order: BN4199, BC98, and CL0438. (A) Heterotic phenotypes at the seedling stage. (B) The heterotic phenotypes at the adult plant stage. (C) Heterotic phenotypes of the grains. (D) The heterotic phenotypes of the spikes
Fig. 2
Fig. 2
Venn diagram comparisons and hierarchical clustering analysis of differentially expressed genes (DEGs) among the plant lines. (A) Venn diagram comparison of the DEGs at the anthesis (AN) stage. (B) Venn diagram comparison of the DEGs at the grain-filling (GF) stage. (C) Venn diagram comparison of the DEGs between the AN and GF stages. (D) Hierarchical clustering analysis of the DEGs among the plant lines. The color scale in (D) represents the log10(FPKM + 1) values, with red indicating relatively high expression and blue indicating relatively low expression
Fig. 3
Fig. 3
Comparative analysis and functional enrichment analysis of additive and non-additive genes in hybrid plants across developmental stages. (A) Distribution of additive and non-additive genes at the anthesis (AN) and grain-filling (GF) stages. a denotes high-parent dominance, and b indicates low-parent dominance. (B) Venn diagram depicting inheritance pattern transitions between the AN and GF stages. (C) Gene Ontology enrichment of the additive genes. (D) Stage-specific Gene Ontology enrichment patterns of BN4199-dominant genes in the hybrids at the AN and GF stages
Fig. 4
Fig. 4
Allele-specific expression patterns in the hybrids at the anthesis (AN) and grain-filling (GF) stages. Proportions of genes with monoallelic expression, preferential expression, and biallelic expression profiles in the hybrids at the AN stage (A) and GF stage (B)
Fig. 5
Fig. 5
Classification of cis- and trans-regulation in wheat hybrids. The composite plot of the scatter plot and bar graph summarizes allele-specific expression divergence between the parental lines and the F1 hybrids. The genes ​are color-coded according to the classified cis- and trans-regulatory mechanisms. The bar graphs show the stage-specific gene counts of the regulatory categories detected in the wheat flag leaves at the anthesis (A) and grain-filling (B) stages
Fig. 6
Fig. 6
Contributions of cis- and trans-regulation at different developmental stages. The absolute magnitude of the gene expression divergence in the parental lines resulting from cis-only, trans-only, cis + trans, cis × trans, compensatory, and conserved regulation in wheat flag leaves at the anthesis (AN) stage (A) and grain-filling (GF) stage (B). Box-and-whisker plots showing the percent contribution of cis-only regulation (% cis) to total divergence, categorized by the magnitude of parental log2 expression differences (x-axis) in wheat flag leaves at the AN (C) and GF stages (D)
Fig. 7
Fig. 7
Functional enrichment and pathway analysis of co-expression modules. (A) GO term enrichment of the Brown module; (B) KEGG pathway enrichment bubble plot of the Brown module; (C) GO term enrichment of the Red module; (D) KEGG pathway enrichment bubble plot of the Red module
Fig. 8
Fig. 8
Hub genes and key transcription factors (TFs) identified in the two target modules. L and H between parentheses denote low-parent dominance and high-parent dominance, respectively. The AN and GF stages represent the anthesis and grain-filling stages, respectively. The color gradient from blue to red indicates increasing gene expression levels. The blue‒white‒red gradient represents Z score-normalized expression levels (µ = 0, σ = 1), with blue indicating baseline expression (Z = 0) and red denoting significant upregulation (Z ≥ 2)
Fig. 9
Fig. 9
Schematic diagram of the stage-specific molecular regulatory network underlying heterosis in flag leaves of hybrid wheat. The gradient color blocks represent the percentage of differentially expressed genes with maternal (M) BN4199 dominance and paternal (P) CL0438 dominance among non-additive genes in the hybrid plant at the anthesis (AN) and grain-filling (GF) stages. The gradient-colored arrowed horizontal axis and the green rightward long arrow represent the developmental transition from the AN stage to the GF stage. Purple upward arrows indicate an increasing proportion of genes under this pattern, while green downward arrows indicate a decreasing proportion of genes

Similar articles

References

    1. Birchler JA, Yao H, Chudalayandi S, Vaiman D, Veitia RA, Heterosis. Plant Cell. 2010;22(7):2105–12. - PMC - PubMed
    1. Liu W, Zhang Y, He H, He G, Deng X. From hybrid genomes to heterotic trait output: challenges and opportunities. Curr Opin Plant Biol. 2022;66:102193. - PubMed
    1. Duvick DN. Biotechnology in the 1930s: the development of hybrid maize. Nat Rev Genet. 2001;2(1):69–74. - PubMed
    1. Longin CFH, Mühleisen J, Maurer HP, Zhang H, Gowda M, Reif JC. Hybrid breeding in autogamous cereals. Theor Appl Genet. 2012;125(6):1087–96. - PubMed
    1. Shewry PR, Hey SJ. The contribution of wheat to human diet and health. Food Energy Secur. 2015;4(3):178–202. - PMC - PubMed

LinkOut - more resources