Multicenter Study
. 2025 Sep 2;29(1):392.
doi: 10.1186/s13054-025-05639-6.

Plasma proteomics identifies molecular subtypes in sepsis

Affiliations
Multicenter Study

Plasma proteomics identifies molecular subtypes in sepsis

Thilo Bracht et al. Crit Care. .

Abstract

Background: The heterogeneity of sepsis represents a significant challenge to the development of personalized sepsis therapies. Sepsis subtyping has therefore emerged as an important approach to this problem, but its impact on clinical practice was limited due to insufficient molecular insights. Modern proteomics techniques allow the identification of subtypes and provide molecular and mechanistical insights. In this study, we analyzed a prospective multi-center sepsis cohort using plasma proteomics to describe and characterize sepsis plasma proteome subtypes.

Methods: Plasma samples were collected from 333 patients at days 1 and 4 of sepsis and analyzed using liquid chromatography coupled to tandem mass spectrometry. Plasma proteome subtypes were identified using K-means clustering and characterized based on clinical routine data, cytokine measurements, and proteomics data. A random forest machine learning classifier was generated to showcase future assignment of patients to subtypes.

Results: Four subtypes with different sepsis severity were identified. Cluster 0 represented the most severe form of sepsis, with 100% mortality. Cluster 1, 2 and 3 showed a gradual decrease of the median SOFA score, as reflected by clinical data and cytokine measurements. At the proteome level, the subtypes were characterized by distinct molecular features. We observed an alternating immune response, with cluster 1 showing prominent activation of the adaptive immune system, as indicated by elevated levels immunoglobulin (Ig) levels, which were verified using orthogonal measurements. Cluster 2 was characterized by acute inflammation and the lowest Ig levels. Cluster 3 represented the sepsis proteome baseline of the investigated cohort. We generated an ML classifier and optimized it for the minimum number of proteins that could realistically be implemented into routine diagnostics. The model, which was based on 10 proteins and Ig quantities, allowed the assignment of patients to clusters 1, 2 and 3 with high confidence.

Conclusion: The identified plasma proteome subtypes provide insights into the immune response and disease mechanisms and allow conclusions on appropriate therapeutic measures, enabling predictive enrichment in clinical trials. Thus, they represent a step forward in the development of targeted therapies and personalized medicine for sepsis.

Keywords: Clinical routine data; Hierarchical clustering; Machine learning; Plasma; Precision medicine; Sepsis; Subclasses.


Conflict of interest statement

Declarations. Ethics approval and consent to participate: The SepsisDataNet.NRW and CovidDataNet.NRW studies were approved by the Ethics Committee of the Medical Faculty of Ruhr-University Bochum (Registration No. 5047–14 and 19-6606_6-BR, respectively) or the responsible ethics committee of each respective study center and conducted in accordance with the revised Declaration of Helsinki. Written informed consent was obtained from the patients or a legal representative. Consent for publication: Not applicable. Competing interests: The authors declare no competing interests.

Figures

Fig. 1
Fig. 1
Clinical characteristics of sepsis plasma proteome subtypes. a Distribution of SOFA scores across the four clusters shown as boxplots. Boxes represent 25th and 75th percentiles, whiskers extend to the most extreme data points, median shown as a horizontal line, p-values from Dunn’s post-hoc test. b Sankey diagram showing the assignment of patients to proteome subtypes at day 1 and day 4, respectively. The endpoint is the 30-day survival. Data shown for n = 250 patients; n = 83 patients who were discharged from the ICU between day 1 and day 4 are not displayed. c Kaplan-Meier analysis according to 30-day survival for the four subtypes. d Heatmaps illustrating clinical routine data at day 1 and day 4. Only parameters which were significant between the clusters 1, 2 or 3 are shown (Bonferroni corrected Kruskal-Wallis followed by Dunn’s test). Data was aggregated by the mean, z-transformed, and clustered using Euclidean distance with Ward’s linkage method. e Boxplots illustrating cytokine measurements at day 1. Boxes represent 25th and 75th percentiles, whiskers extend to the most extreme data points, median shown as a horizontal line, outliers shown as individual data points, p-values from Dunn’s post-hoc test
Fig. 2
Fig. 2
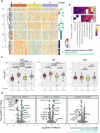
Proteome characteristics of sepsis plasma proteome subtypes. a Heatmap showing significantly differentially abundant proteins at day 1 (ANOVA pFDR value ≤ 0.05, post-hoc test p value ≤ 0.05, ratio of means ≥ 1.5 or ≤ 0.67). Protein intensities were z-transformed and clustered using Pearson clustering with Ward’s linkage method. The first five branches in the dendrogram were divided and labeled with Greek letters to discriminate abundance patterns. Protein annotation with selected Gene Ontology or KEGG categories is indicated on the right. b Functional enrichment of significantly differential proteins in comparison to cluster 0. Eight selected categories shown for day 1 and day 4 and the three pairwise comparisons with cluster 0. Enrichment analysis was done with string-db.org (v.12) using GO biological processes (GOBP). c Immunoglobulin measurements as boxplot representation. Boxes represent 25th and 75th percentiles, whiskers extend to the most extreme data points, median shown as a horizontal line, outliers shown as individual data points, p-values calculated by Dunn’s post-hoc test. d Volcano plots illustrating the pairwise comparisons between clusters 1, 2 and 3 for day 1. Proteins annotated with significantly enriched GOBP terms were highlighted and labeled with gene names. Dashed lines indicate the applied significance threshold
Fig. 3
Fig. 3
Feature selection and machine learning model performance: a Scatter plots representing the mean recall as a function of the number of medical features included. The purple dashed line shows the mean recall when using only protein features. The transparent area curve represents the standard deviation. The red dotted line indicates the computed knee point, where the slope of the curve decreased significantly. With only few proteins available, medical features had a stronger impact on model performance, with increasing number of proteins this effect diminished. b Bar plot showing the mean SHAP values for the features used in model training. The colours indicate the contribution of each feature to the respective clusters. c Box plots of feature ranks for each cluster, based on the relevance of the features within the model across all MCCV iterations. Boxes represent 25th and 75th percentiles, whiskers extend to the most extreme data points, median shown as a red line, outliers shown as individual data points

References

    1. Singer M, Deutschman CS, Seymour CW, Shankar-Hari M, Annane D, Bauer M, Bellomo R, Bernard GR, Chiche JD, Coopersmith CM, et al. The third international consensus definitions for sepsis and septic shock (Sepsis-3). JAMA. 2016;315(8):801–10. - PMC - PubMed
    1. Rudd KE, Johnson SC, Agesa KM, Shackelford KA, Tsoi D, Kievlan DR, et al. Global, regional, and national sepsis incidence and mortality, 1990–2017: analysis for the global burden of disease study. Lancet. 2020;395(10219):200–11. - PMC - PubMed
    1. Evans L, Rhodes A, Alhazzani W, Antonelli M, Coopersmith CM, French C, et al. Surviving sepsis campaign: international guidelines for management of sepsis and septic shock 2021. Intensive Care Med. 2021;47(11):1181–247. - PMC - PubMed
    1. Marshall JC. Why have clinical trials in sepsis failed? Trends Mol Med. 2014;20(4):195–203. - PubMed
    1. Scicluna BP, Baillie JK. The search for efficacious new therapies in sepsis needs to embrace heterogeneity. Am J Respir Crit Care Med. 2019;199(8):936–8. - PMC - PubMed

Publication types

LinkOut - more resources