. 2025 Sep 2;23(1):390.
doi: 10.1186/s12964-025-02376-9.

ATE1 promotes breast cancer progression via arginylation-dependent regulation of MAPK-MYC signaling

Affiliations

ATE1 promotes breast cancer progression via arginylation-dependent regulation of MAPK-MYC signaling

Laxman Nawale et al. Cell Commun Signal. .

Abstract

Background: Arginyl-tRNA-protein transferase (ATE1) catalyzes N-terminal arginylation, a regulatory protein modification implicated in various cellular processes, including proliferation, apoptosis, and migration. Although ATE1 has context-dependent roles in cancer, its specific function in breast cancer remains unclear. This study investigates the oncogenic role of ATE1 across multiple breast cancer subtypes and its underlying molecular mechanisms.

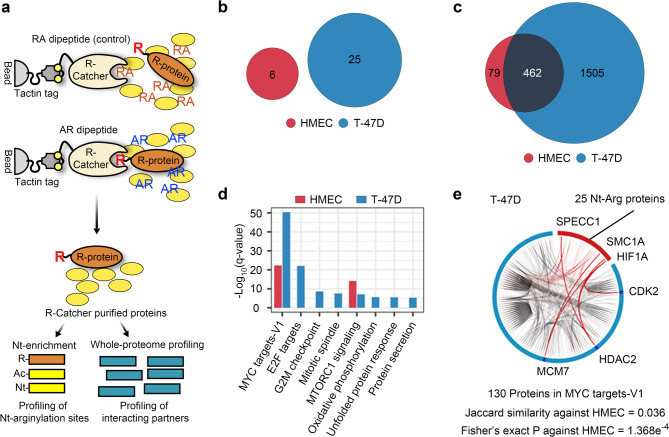
Methods: ATE1 expression in breast cancer was evaluated using TCGA data and immunoblotting across breast cancer cell lines and normal mammary epithelial cells (HMEC). Functional studies using siRNA- and shRNA-mediated knockdown assessed ATE1's role in cell viability, clonogenic growth, migration, and tumorigenesis in vitro and xenograft models. Quantitative proteomics, R-catcher-based N-terminomics, and pathway analyses were employed to identify ATE1-dependent signaling networks, with a focus on MAPK-MYC axis regulation. Flow cytometry and immunoblotting were used to assess cell cycle progression, apoptosis, and MYC stability.

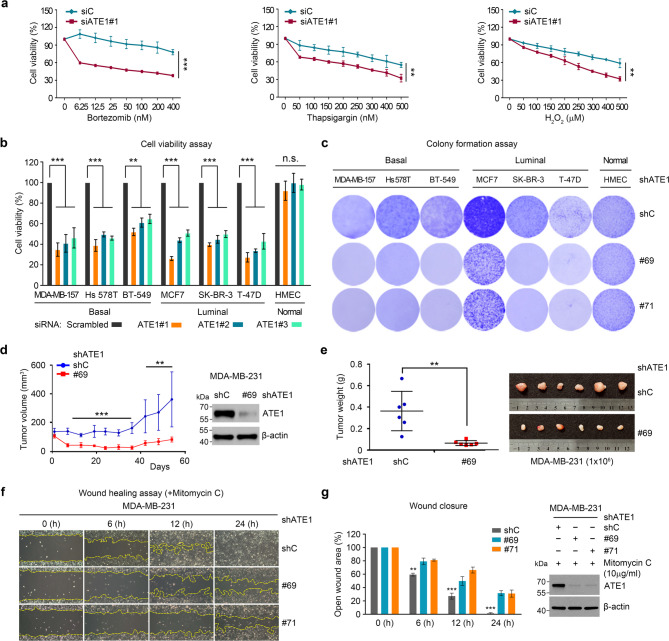
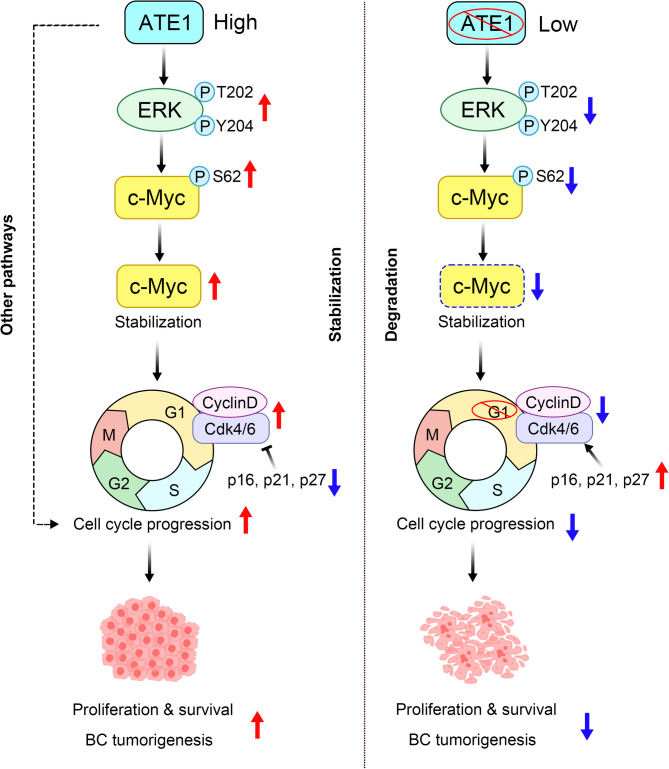
Results: ATE1 was significantly upregulated in breast cancer cells and associated with poor prognosis in early-stage patients. ATE1 depletion selectively impaired viability, proliferation, and migration in breast cancer cells, but not in HMECs. In vivo, ATE1 silencing suppressed tumor growth in xenograft models. Proteomic profiling revealed that ATE1 regulates the cell cycle and survival pathways in a subtype-specific manner, particularly through modulation of the MAPK-MYC-CDK6 axis in luminal T-47D cells. ATE1 stabilized MYC protein via ERK-mediated phosphorylation at Ser62, promoting cell cycle progression and suppressing apoptosis. Rescue experiments confirmed that ATE1's tumor-promoting activity depends on its arginyltransferase function.

Conclusions: ATE1 promotes breast cancer progression by enhancing cell proliferation, survival, and migration through MAPK-dependent stabilization of MYC in a lineage-specific context. These findings identify ATE1 as a potential therapeutic target and highlight the relevance of protein arginylation in the molecular heterogeneity of breast cancer.

Keywords: ATE1 (arginyltransferase 1); Breast cancer; Cell proliferation; Cell survival; MYC signaling; N-degron pathway; N-terminal arginylation; Tumor progression.


Conflict of interest statement

Declarations. Ethics approval and consent to participate: All animal experiments were approved by the Animal Care and Ethics Committee of the Korea Research Institute of Bioscience and Biotechnology (Approval No. KRIBB-AEC-14124; Daejeon, Korea), which also provided oversight and support for this study. Consent for publication: Not applicable. Competing interests: The authors declare no competing interests.

Figures

Fig. 1
Fig. 1
ATE1 upregulation in breast cancer. a Diagram illustrating the Arg/N-degron pathway in mammals. Single-letter codes represent N-terminal (Nt) amino acids. Yellow line represents the remainder of the protein substrate. Tertiary destabilizing residues Nt-Asn (N) and Nt-Gln (Q) undergo deamidation, whereas Nt-Cys (C) is oxidized into secondary destabilizing residues Nt-Asp (D), Nt-Glu (E), and Nt-Cys (C*). These secondary residues are arginylated by arginyl-tRNA transferase1 (ATE1), resulting in Nt-Arg, a primary destabilizing residue. UBR box E3 ligases (N-recognins) attach to Nt-arginylated proteins and facilitate their breakdown through the ubiquitin-proteasome system (UPS). p62, another N-recognin, binds to Nt-arginylated proteins and promotes degradation via the autophagy-lysosome pathway. b Kaplan-Meier plots illustrating overall survival (OS) analysis in breast cancer, with groups categorized by the median level of ATE1 expression. c Kaplan-Meier curves illustrating the overall survival (OS) of patients with early-stage breast cancer. The graph on the left compares the patients with elevated ATE1 expression (n = 18) with the remaining patients (n = 782). On the right, the comparison is between those with high (n = 18) and low (n = 180) ATE1 expression. An inverse relationship exists between ATE1 expression and OS in patients with early-stage breast cancer. d ATE1 protein levels (top) were assessed in basal and luminal breast cancer cell lines, as well as in HMEC. Significance was evaluated in comparison with the HMEC. The results are shown as the mean ± SD from three biologically independent experiments. p > 0.05 = n.s., **p < 0.01, ***p < 0.001, using one-way ANOVA with Dunnett’s multiple comparison test. Western blot analysis (bottom) shows ATE1 expression levels across the tested cell lines, allowing direct comparison of relative expression. Band intensity was quantified relative to β-actin and is presented as mean ± SD from three independent biological replicates. HMEC refers to non-transformed human mammary epithelial cells
Fig. 2
Fig. 2
Various oncogenic roles of ATE1 in breast cancer. a T-47D cells were transfected with 20 nM siRNA (ATE1#1) targeting ATE1, or a scrambled negative control. Following 24 h post-transfection, the cells were exposed to various stressors for another 24 h and cell viability was assessed using water-soluble tetrazolium salts (WSTs). The constitutive stresses used were bortezomib (proteasome inhibitor), thapsigargin (ER stress inducer), and H2O2 (oxidative stress inducer). Data are shown as mean ± SD from three separate experiments (n = 3). **p < 0.01, ***p < 0.001, using a two-tailed unpaired t-test. b Breast cancer cell lines, both basal and luminal, along with normal HMEC cells, were transfected with 20 nM siRNAs (ATE1#1, ATE1#2, and ATE1#3) targeting ATE1 or a scrambled negative control. Seventy-two hours after transfection, cell viability was assessed using WSTs. The results were normalized against scrambled siRNA (siC) and expressed as mean ± SD from four independent cell cultures (n = 4). Statistical significance was determined using a two-tailed Student’s t-test, with p > 0.05 considered not significant (n.s.), **p < 0.01, and ****p < 0.0001. c ATE1 was knocked down using two different ATE1-targeting shRNAs (shATE1#69 and shATE1#71) in both basal and luminal breast cancer cell lines and in normal HMEC cells. After 4–14 days of lentiviral transduction, the clonogenic survival assay was performed by crystal violet staining in a six-well plate. Representative images are shown (n = 3, independent cell cultures). d Female BALB/c mice were subcutaneously injected with MDA-MB-231 cells that had been stably transfected with either shC- or ATE1-targeting shRNA (shATE1#69). Subcutaneous tumor volumes were determined using the formula: volume (mm3) = length (mm) × width2 (mm2) × 0.52. The data are expressed as the mean ± SD, with six mice in each group. **p < 0.01, ***p < 0.001, two-tailed Student’s t-test. e Tumor wt (left) was assessed on day 54, and representative images (right) are shown. Data are shown as mean ± SD (n = 6 mice per group). **p < 0.005, two-tailed Student’s t-test. f ATE1 was knocked down using two different ATE1-targeting shRNAs (shATE1#69 and shATE1#71) for 24 h in MDA-MB-231 cells. Subsequently, the cells were treated with mitomycin C (10 µg/ml) for 2 h. Post-scratch assay bright-field images of migrated cells were taken at different time points, and representative images (10x magnification) are shown (n = 2 independent cell cultures). Scale bars, 100 μm. g Measurement of the wound closure area in MDA-MB-231 cells with reduced ATE1 expression, as detailed in f. Data are shown as mean ± SD from two separate experiments (n = 2). Statistical significance is indicated by **p < 0.01, and ***p < 0.001, using two-way ANOVA followed by Bonferroni’s post hoc test
Fig. 3
Fig. 3
The effect of ATE1 on breast cancer cell proliferation. a ATE1 was knocked down using two different ATE1-targeting shRNAs (shATE1#69 and shATE1#71) for 48 h in T-47D, MDA-MB-157, and HMEC. Immunofluorescence (IF) imaging of BrdU-positive cells was conducted in three separate experiments, resulting in a total of nine images. Nuclei were stained with DAPI and appeared blue. Scale bars represent 100 µM. b T-47D, MDA-MB-157, Hs 578T, and MCF7 cells were transfected with shC- or ATE1-targeting shRNAs (shATE1#69 and shATE1#71). The percentage of cell proliferation was assessed daily using the WSTs. In the cell proliferation graph, each point indicates the mean ± SD of three experimental replicates (n = 3). Statistical significance was denoted by ***p < 0.001, determined using two-way ANOVA followed by Bonferroni’s post hoc test. c Female BALB/c mice were subcutaneously injected with MDA-MB-231 cells stably transfected with shC, ATE1 shRNA (shATE1#69), ATE1-knockdown cells rescued with Wt-hATE1-1, or cells expressing Mut-hATE1-1. Subcutaneous tumor volumes were determined using the formula: volume (mm3) = length (mm) × width2 (mm2) × 0.52. The data are expressed as the mean ± SD, with six mice in each group. Statistical significance was denoted by ***p < 0.001, determined using two-way ANOVA followed by Bonferroni’s post hoc test. d Tumor wt (left) was assessed on day 37, and representative images are displayed on the right. Data are shown as mean ± SD, with six mice per group (n = 6). *p < 0.05, **p < 0.005, ***p < 0.0005, using a two-tailed Student’s t-test
Fig. 4
Fig. 4
Proteomic analysis following Nt-arginylation affinity purification. a Schematic of N-terminomic and whole-proteome analyses of the R-catcher-enriched proteins. b-c Venn diagrams illustrate the presence of Nt-arginylated proteins within designated cell lines b alongside the associated interacting proteins c. d An ORA with gene sets of the Hallmark collection in MsigDB, applied to the proteins identified in the whole-proteome profiling. e Protein-protein interactions of T-47D cell line between Nt-arginylated proteins and the proteins in whole-proteome profiling. Red edge, direct interactions between Nt-arginylated and MYC_TARGETS_V1. Black edge, interactions between the MYC_TARGETS_V1 proteins from first-degree interactors. The edges were obtained from the STRING database
Fig. 5
Fig. 5
Knockdown of ATE1 induces G1 cell cycle arrest. a ATE1 was knocked down using two different ATE1-targeting shRNAs (shATE1#69 and shATE1#71) for 72 h in T-47D and MDA-MB-157 cells. After treatment with bromodeoxyuridine (BrdU, 10 µM) for 1 h, the cells were harvested, and cell cycle profiling was assessed using CytoFLEX flow cytometry. Representative images of cell cycle phases (n = 3 independent biological replicates). Histograms show 7-AAD staining (x-axis) vs. BrdU-FITC staining (y-axis). b T-47D and MDA-MB-157 cells with ATE1 knockdown (shATE1#69) were synchronized using the double thymidine (2mM) block method. Following release from this block at specified intervals, cell lysates were collected. The effect of ATE1 depletion on the expression levels of cell cycle regulators, including cyclin D, CDK4, CDK6, p-Rb (S-795), total Rb, cyclin E, cyclin A, CDK2, and cyclin B, were assessed using western blot analysis. Band intensities were quantified, normalized to β-actin, and presented as mean ± SD from three independent biological replicates. c Knockdown of ATE1 indicated an abundance of apoptotic cells. ATE1 was knocked down using two different shRNAs (shATE1#69 and shATE1#71) for 72 h in T-47D and MDA-MB-157 cells. Following transduction, cells were collected and labeled with Annexin V-FITC and propidium iodide (PI). Representative images of apoptosis by CytoFLEX flow cytometry (n = 3 independent biological replicates). The cell distribution in apoptotic groups was as follows: dark teal square represents early apoptosis and red square represents late apoptosis. Histograms show annexin V-FITC binding (x-axis) vs. propidium iodide staining (y-axis). d Western blotting represents the enriched cleavage of apoptosis markers, such as PARP and caspase-3, in ATE1-depleted cells, as described in c. The cells were exposed to apicidin at a concentration of 1 µg/ml for 24 h to trigger apoptosis, serving as a positive control. β-actin was utilized as a loading control
Fig. 6
Fig. 6
The role of ATE1 in MYC stability. a T-47D and MDA-MB-157 cells with ATE1 knockdown (shATE1#69) were synchronized using the double thymidine (2mM) block method. Following release at the indicated time points, cell lysates were collected. The expression levels of endogenous MYC, p-MYC (S-62), p-ERK1/2 (T202/Y204), total ERK1/2, p-AKT (S-473), p-AKT (T-308), and total AKT were analyzed by western blot. b The effect of ATE1 depletion on the expression of MYC, p27, p21, and p16 in T-47D cells, as outlined in a, was assessed by western blot analysis. c T-47D cells were transfected with 20 nM siRNA (ATE1#1) against ATE1 or a scrambled negative control for 36 h. After cycloheximide (CHX, 10 µM) treatment, cells were harvested at 30-min intervals, lysed, and analyzed by western blot using a MYC antibody. d The intensities of MYC bands were measured using ImageJ software. The graph shows the percentage of MYC remaining relative to β-actin. Data are presented as mean ± SD from three independent experiments (n = 3). Statistical significance was determined by two-tailed unpaired t-test (*p < 0.05; **p < 0.01; ***p < 0.001). For all western blot panels, band intensities were quantified, normalized to β-actin, and presented as mean ± SD from three independent biological replicates
Fig. 7
Fig. 7
Model illustrating ATE1’s function as a new MYC regulator in breast cancer development

References

    1. Varshavsky A. The N-end rule pathway and regulation by proteolysis. Protein Sci Wiley-Blackwell. 2011;20:1298–345. - PMC - PubMed
    1. Wang J, Han X, Wong CCL, Cheng H, Aslanian A, Xu T, et al. Arginyltransferase ATE1 catalyzes midchain arginylation of proteins at side chain carboxylates in vivo. Chem Biology Elsevier. 2014;21:331–7. - PMC - PubMed
    1. Varshavsky A. N-degron and C-degron pathways of protein degradation. Proc Natl Acad Sci. 2019;116:358–66. - PMC - PubMed
    1. Cha-Molstad H, Kwon YT, Jang JM, Kim SY, Kim BY, Hwang J, et al. Amino-terminal arginylation targets Endoplasmic reticulum chaperone bip for autophagy through p62 binding. Nat Cell Biology Springer Nat. 2015;17:917–29. - PMC - PubMed
    1. Cha-Molstad H, Shim SM, Kim SJ, Kim KP, Song HD, Yu JE, et al. p62/SQSTM1/Sequestosome-1 is an N-recognin of the N-end rule pathway which modulates autophagosome biogenesis. Nat Comm. 2017;8:102. - PMC - PubMed

LinkOut - more resources