. 2025 Nov;12(43):e07411.
doi: 10.1002/advs.202507411. Epub 2025 Sep 2.

Succinic Acid-Induced Macrophage Endocytosis Promotes Extracellular Vesicle-Based Integrin Beta1 Transfer Accelerating Fibroblast Activation and Sepsis-Associated Pulmonary Fibrosis

Affiliations

Succinic Acid-Induced Macrophage Endocytosis Promotes Extracellular Vesicle-Based Integrin Beta1 Transfer Accelerating Fibroblast Activation and Sepsis-Associated Pulmonary Fibrosis

Wenyu Yang et al. Adv Sci (Weinh). 2025 Nov.

Abstract

Sepsis-associated pulmonary fibrosis (SAPF) is a life-threatening condition driven by persistent fibroblast activation and excessive extracellular matrix (ECM) deposition. While metabolic reprogramming, profibrotic extracellular vesicles (EVs), and integrin activation are implicated in pulmonary fibrosis, their interplay remains unclear. This study reveals that succinic acid, a product of glycometabolic reprogramming, promotes macrophage-mediated endocytosis, driving the release of profibrotic EVs. These EVs transfer integrin beta1 (ITGβ1) from macrophages to fibroblasts, activating fibroblasts and advancing SAPF. Through Single-cell RNA sequencing (scRNA-seq), proteomics, immunofluorescence, and electron microscopy, the critical role of EV-mediated ITGβ1 transfer in macrophage-fibroblast communication is identified. Knockdown of ITGβ1 or Alix, a mediator of multivesicular bodies (MVBs) biogenesis, inhibited profibrotic EVs formation and alleviated SAPF. These findings highlight a novel mechanism in that the transfer ITGβ1 via EVs plays a critical role in macrophage-fibroblast communication, representing a novel mechanism underlying SAPF. Targeting EV-mediated ITGβ1 transfer can provide a promising therapeutic strategy to alleviate the progression of SAPF.

Keywords: extracellular vesicles; integrin β1; macrophage‐fibroblast communication; pulmonary fibrosis; sepsis.


Conflict of interest statement

The authors declare no conflict of interest.

Figures
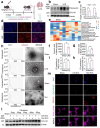
Figure 1
Figure 1
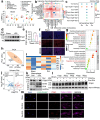
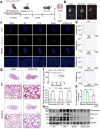
Elevated succinic acid and profibrotic EVs secretion in LPS‐induced pulmonary fibrosis. a) Schematic showing LPS‐induced pulmonary fibrosis progression. LPS was administered intraperitoneally for 3 consecutive days and samples were collected one week later. b–c) Western blot and the corresponding quantitative analysis to detect fibrosis markers Fibronectin and COL1A1 after LPS treatment (Mean ± s.d., * P < 0.05, ** P < 0.01, unpaired t‐test, n = 3). d) Immunofluorescence analysis of lung tissues from the sham and LPS groups in mice revealed the expression and distribution of COL1A1.Scale bar=200 µm. e) Metabolomics to analyze the changes in various metabolites in the lung tissues of mice, with the results presented in the form of a heatmap (n = 5). f–g) Succinic acid metabolic profiles measurement in lung tissues (n = 3) and BALF (n = 5) from sham and LPS groups (Mean ± s.d., ** P < 0.01, unpaired t‐test). h–i) TEM images, NTA analysis and the corresponding statistics of EVs in BALF. Scale bar=100 nm. j–k) Purified EVs derived from macrophages were determined using TEM images, NTA analysis (Mean ± s.d., ** P < 0.01, unpaired t‐test). Scale bar=100nm. l) Western blot to detect the expression of COL1A1 in fibroblasts stimulated with 10–50 µg of macrophages‐derived EVs. “Ctrl‐EVs” = EVs released by the control group macrophages, “Suc‐EVs” = EVs released by the macrophages stimulated with succinic acid. m) Immunofluorescence analysis of COL1A1 in fibroblasts stimulated with 40 µg EVs. PKH67‐labeled EVs appeared as green punctate structures and phalloidin (magenta)‐labeled F‐actin represents the cell outline. Scale bar=10 µm. Suc=Succinic acid. The partial results presented in Figure 2 and 5 are derived from the samples generated during present experiment, which were displayed in relevant Figures to adhere to the logical coherence required for the presentation of the findings.
Figure 2
Figure 2
Macrophage‐derived profibrotic EVs transfer ITGβ1 to activate fibroblasts. a) RNA expression data from lung tissues of sham and LPS groups were analyzed using Uniform Manifold Approximation and Projection (UMAP) and clustering techniques. b) Differential interaction count heatmap between cells, as recommended by CellChat. c) Bubble plots further quantitatively visualized major intercellular signaling pathway interactions, including those from macrophages to fibroblasts and monocytes to fibroblasts. d,e) Western blot and the corresponding quantitative analysis to determine the expression of ITGβ1 from sham and LPS‐stimulated lung tissues (Mean ± s.d., ** P< 0.01, unpaired t‐test, n = 3). f) Immunofluorescence analysis of ITGβ1 w/wo LPS stimulation. Scale bar=200 µm. g) KEGG analysis of pathways enriched by upregulated differentially expressed genes (DEGs) in fibroblasts and myofibroblasts. h) Principal component analysis (PCA) plot demonstrated the spatial relationship of cell proteomic profiles of EVs from macrophages. i) The heatmap showed the relative protein expression levels of 7 integrin family members in EVs from the sham and Suc groups. In each enrolled case, red indicates upregulated proteins, whereas blue indicates downregulated proteins (n = 3). j) Volcano plot of differential proteins between the sham and the Suc groups. The x‐axis represents the fold change of differential proteins (log2 value), whereas the y‐axis represents the p‐value (‐log10 value). Grey indicates non‐significant proteins, red denotes upregulated proteins, while blue denotes downregulated proteins. k) Western blot of a cell lysate and an EVs preparation. l) Western blot analysis to examine the expression levels of ITGβ1 in fibroblasts stimulated with 10–50 µg of EVs derived from macrophages. m) Immunofluorescence analysis of ITGβ1 in primary fibroblasts stimulated with 40 µg EVs. Scale bar = 10 µm.
Figure 3
Figure 3
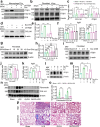
ITGβ1 is critical for profibrotic EVs secretion, LPS‐induced fibroblast activation, and pulmonary fibrosis. Western blot analysis to detect the expression levels of ITGβ1 in a) EVs derived from macrophages w/wo Itgb1 knockdown combined with succinic acid treatment and b,c) fibroblasts treated with 40 µg of the corresponding EVs and quantitative analysis. “shITGβ1‐EVs” = EVs released by macrophage stable cell lines with ITGβ1 knockdown. “Suc+shITGβ1‐EVs” = EVs released by the ITGβ1 knockdown stable cell lines stimulated with succinic acid. (Mean ± s.d., * P< 0.05, ** P< 0.01, One‐Way ANOVA, n = 3). d,e) Western blot analysis to detect the expression of COL1A1 in fibroblasts treated with 40 µg of the Suc‐EVs w/wo Itgb1 knockdown and quantitative analysis. (Mean ± s.d., *** P< 0.001, One‐Way ANOVA, n = 3). f) RT‐PCR analysis to detect mRNA levels of Itgb1 in fibroblasts stimulated with different concentrations of either Suc‐EVs or succinic acid. (Mean ± s.d., * P< 0.05, ** P< 0.01, “ns” indicating not significant. One‐Way ANOVA, n = 3). g–j) Western blot and quantitative analysis to detect the aforementioned indicator. k–m) RT‐PCR and western blot to quantitative analysis the Itgb1 in fibroblasts following Suc‐EVs treatment w/wo 10 µm chlorpromazine (CPZ) or 4 °C pretreated for 1 h. (Mean ± s.d., * P< 0.05, *** P< 0.001. n–o) Western blot and the corresponding quantitative analysis to assess Fibronectin and COL1A1 levels following LPS treatment w/wo 100 mg/kg GLPG0187. (Mean ± s.d., *** P< 0.001, Two‐Way ANOVA, n = 3). p) H&E and Masson staining of LPS‐treated lung tissues, w/wo GLPG0187 for 3 days. The images are representative of more than three mice per group. Scale bar=100 µm.
Figure 4
Figure 4
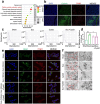
Succinic acid promotes ITGβ1 endocytosis, inducing MVBs formation and EVs secretion in macrophages. a) GO analysis of upregulated DEGs derived from M2 macrophages in the lung tissues of mice stimulated with LPS. b) Immunofluorescence analysis to detect the relative expression and distribution of clathrin and macrophage marker F4/80. Scale bar=200 µm. c,d) NTA and the corresponding quantitative analysis to assess the size distribution and quantity of EVs in macrophages following succinic acid treatment, w/wo 10 µm cytoD pretreatment for 1 h. (Mean ± s.d., * P< 0.05, *** P< 0.001, One‐Way ANOVA, n = 3). e) Immunofluorescence analysis of MVBs marker EEA1 and ITGβ1 in macrophages stimulated with 5 mm succinic acid for 30 or 180 min, w/wo cytoD pretreatment. Scale bar=10 µm. f) TEM images were performed to visualize the morphology and quantity of MVBs and ILVs in macrophages after succinic acid treatment, w/wo cytoD pretreatment. Red arrows mark MVBs. Scale bar=0.5/0.25 µm (magnified view).
Figure 5
Figure 5
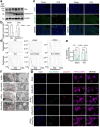
Syntenin‐1 and Alix regulate endocytosis‐driven MVBs formation and EVs secretion. a,b) Western blot and the corresponding quantitative analysis to determine the expression levels of Alix and Syntenin‐1 from sham and LPS‐stimulated lung tissues (Mean ± s.d., ** P< 0.01, Two‐Way ANOVA, n = 3). c) Immunofluorescence was used to analyze Alix and Syntenin‐1 expression levels and distribution in mice lung tissues w/wo LPS stimulation. The images are representative of more than three mice per group. Scale bar=200 µm. d,e) NTA and the corresponding quantitative analysis to assess the size distribution and quantity of EVs in macrophages following 5 mM succinic acid treatment, w/wo Alix or Syntenin‐1 knockdown (Mean ± s.d., * P< 0.05, *** P< 0.001, Two‐Way ANOVA, n = 3). NC = Negative Control. f) TEM images to analyze the morphology and quantity of MVBs and ILVs in macrophages after succinic acid treatment, w/wo Alix or Syntenin‐1 knockdown. Scale bar=0.5/0.25 µm (magnified view). g) Immunofluorescence was conducted to detect COL1A1 in fibroblasts stimulated with 40 µg EVs, w/wo Alix or Syntenin‐1 knockdown. Scale bar=10 µm.
Figure 6
Figure 6
In vivo inhibition of Alix reduces EVs secretion and alleviates SAPF. a) Schematic illustrating Alix knockdown in LPS‐induced pulmonary fibrosis. Each mouse received an intratracheal injection of 1E13 µg adeno‐associated virus 5 (AAV5) expressing shAlix, followed by intraperitoneal LPS injection 3 weeks later. Mice were sacrificed 1 week after the LPS injection. b) The fluorescence of shRNA‐GFP was detected by an in vivo optical molecular imaging system (IMAGING 200, Raycision Medical Technology CO., Ltd., China). c) The transfection efficiency of vector‐AAV or shAlix‐AAV delivered via intratracheal injection was confirmed by detecting GFP signals using a fluorescence microscope. Scale bar=1500/200 µm (magnified view). d,e) NTA and corresponding quantitative analysis were performed to evaluate the size distribution and quantity of EVs in BALF from sham and LPS‐treated mice w/wo Alix knockdown (Mean ± s.d., *** P< 0.001, One‐Way ANOVA, n = 3). f) Kaplan–Meier analysis of survival rate in LPS‐induced mice w/wo Alix knockdown. n = 10. g) H&E and Masson staining of LPS‐treated lung tissues, w/wo Alix knockdown. The images are representative of more than three mice per group. Scale bar=1500/100 µm (magnified view). h,i) Western blot and the corresponding quantitative analysis to assess Fibronectin and COL1A1 levels. (Mean ± s.d., * P< 0.05, *** P< 0.001, Two‐Way ANOVA, n = 3).

References

    1. Hotchkiss R. S., Moldawer L. L., Opal S. M., Reinhart K., Turnbull I. R., Vincent J.‐L., Nat. Rev. Dis. Primer 2016, 2, 16045.
    1. Mirzapoiazova T., Kolosova I. A., Moreno L., Sammani S., Garcia J. G. N., Verin A. D., Eur. Respir. J. 2007, 30, 429. - PubMed
    1. Li B., Xia C., He W., Liu J., Duan R., Ji Z., Pan X., Zhou Y., Yu G., Wang L., Adv. Sci. 2024, 11, 2401931.
    1. Xian H., Liu Y., Rundberg Nilsson A., Gatchalian R., Crother T. R., Tourtellotte W. G., Zhang Y., Aleman‐Muench G. R., Lewis G., Chen W., Kang S., Luevanos M., Trudler D., Lipton S. A., Soroosh P., Teijaro J., De La Torre J. C., Arditi M., Karin M., Sanchez‐Lopez E., Immunity 2021, 54, 1463. - PMC - PubMed
    1. Sun Z.‐C., Liao R., Xian C., Lin R., Wang L., Fang Y., Zhang Z., Liu Y., Wu J., J. Controlled Release 2024, 375, 300.

LinkOut - more resources