. 2025 Aug 18:12:1604557.
doi: 10.3389/fvets.2025.1604557. eCollection 2025.

Inter-evaluator bias and applicability of feline body condition score from visual assessment

Affiliations

Inter-evaluator bias and applicability of feline body condition score from visual assessment

Emily C Graff et al. Front Vet Sci. .

Abstract

Body Condition Score (BCS) is an effective tool for assessing body weight and fat mass, as well as diagnosing obesity and abnormal weight loss. A method for visual assessment of BCS in cats would be useful to expand access for feline health and research. The goal of this study is to determine whether BCS can be accurately assessed solely from photographs of cats, and to measure inter-evaluator bias in visually assessed BCS. To do this, a set of online-sourced cat images was administered as a quiz to nine evaluators. Inter-evaluator bias was relatively low (mean ± SE = 0.35 ± 0.03) with ~50% complete agreement. To validate the results, a BCS was clinically assessed during routine wellness exams for 38 cats, enrolled, through palpation by one evaluator and visual assessment by all nine evaluators using photographs collected at the exam. The visual assessment of BCS deviated from the clinically assessed BCS by 0.61 ± 0.04, which was slightly higher than the deviation observed in the online-sourced image set. In both scenarios, the majority voting among all evaluators achieved the highest accuracy, demonstrating its effectiveness in reducing evaluator bias. Inter-evaluator bias caused a 15.5% misclassification between ideal and overweight BCS but 1.8% between ideal and obese, indicating minimal bias in diagnosing feline obesity. The ability to accurately assess BCS through photographic evaluation will enhance remote consultations in telemedicine and support large-scale epidemiological studies. This study has developed a method for evaluating and minimizing inter-evaluator bias in BCS assessments across diverse practitioners and settings, thereby improving consistency and comparability and improving our understanding and application of BCS as a tool for feline health.

Keywords: body condition score; body weight; domestic cat; obesity; palpation; telemedicine.


Conflict of interest statement

The authors declare that the research was conducted in the absence of any commercial or financial relationships that could be perceived as a potential conflict of interest. The author(s) declared that they were an editorial board member of Frontiers, at the time of submission. This had no impact on the peer review process and the final decision.

Figures

Figure 1
Figure 1
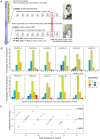
Feline body condition score (BCS) assessments of 50 internet-sourced cat images in BTS1 by 9 evaluators. (A) Nine evaluators grouped by their clinical experience: senior clinicians in feline health (Scorers A and B), Clinicians (Scorers C, D, and E), and DVM students (Scorers F, G, H, and I). (B) Scatterplot illustrates the correlation between the BCS assessments of Scorer A and Scorer B for the cat images in BTS1 cohort (BCS Test Set). The strong positive correlation (Spearman’s correlation coefficient ρ = 0.922, p-value < 0.00001) suggests high consistency between the assessments of these two senior clinicians in feline health. (C) Schematic table demonstrating the majority vote score metric, which is defined as the most common score among evaluators. In cases where there is a tie, the remaining scores are used to resolve it and determine the final score. (D) Barplots depict the distribution of deviations in BCS assessments compared to the judgments by Scorers A and B, which serve as the answer key in judging other scorers/ evaluations. Each subpanel represents a different scorer (C, D, E, F, G, H, and I) to show the percentage of assessments that deviated from Scorers A/B by −2, −1, 0, 1, or 2 points. (E) Bland–Altman plot illustrating the agreement between the average visually assessed BCS scores from the seven evaluators (Scorers C-I) and the closest reference BCS (Scorer A or B) across 50 internet-sourced cat images. The solid horizontal line indicates the mean difference between the evaluator and reference BCS, reflecting minimal systematic bias. The dashed lines represent the limits of agreement (±1.96 standard deviations), highlighting the range within which most differences fall.
Figure 2
Figure 2
Clinically assessed BCS (CA-BCS) through palpation of 38 client-owned cats compared to visual assessments (VA-BCS) by 9 evaluators. (A) Schematic illustrations of the study design. BTS1 (BCS test set 1) images were administered to 9 evaluators shortly after the training session in April 2022. Client-owned cats were enrolled in this study between April 2022 and April 2023. At enrollment, CA-BCS was assessed through palpation in clinical settings by 1 scorer, who was known as the Original Clinical Scorer (OCS). After the conclusion of the enrollment period, BTS2 dataset consisting photographs of 38 client-owned cats from top and side view angles were compiled. BTS2 was administered to the same 9 evaluators to collect VA-BCS data (9 scorers per cat) in April 2024, 2 years after BTS1 assessment. VA-BCS_MV refers to the majority vote among the 9 scores. VA-BCS_OCS refers to the VA-BCS assigned by the original clinical scorer (OCS) who previously determined the CA-BCS during the clinical evaluation. (B) Barplots illustrate the distribution of deviations between CA-BCS and VA-BCS evaluated by each scorer (A-I), the majority vote of the 9 scorers (VA-BCS_MA), and the VA-BCS determined by the original clinical scorer (VA-BCS_OCS). The x-axis represents deviation categories ranging from −4 to +3, while the y-axis denotes the percentage of VA-BCS assessments within each category. (C) Bland–Altman plot comparing the mean VA-BCS for 9 evaluators with CA-BCS for 38 cats. The solid line represents the mean difference between VA-BCS and CA-BCS, indicating minimal bias between the two assessments. The dashed lines represent the 95% limits of agreement (±1.96 SD).
Figure 3
Figure 3
Correlation between visual assessments-based body condition scores (VA-BCS), clinically assessed BCS (CA-BCS), and body weight measurements in 38 client-owned cats. (A) Scatterplot illustrates the correlation between CA-BCS (x-axis) and body weight (y-axis). Spearman’s correlation coefficient ρ and p value were computed. A fitted linear regression line is plotted in blue. (B) Correlation matrix summarizing the relationships among BCS assessments and body weight across different scorers and scoring methodologies. Variables are arranged from top to bottom and left to right in the following order: VA-BCS from 9 individual scorers (Scorers A through I), the majority vote (VA-BCS_MV), the original clinical scorer’s VA-BCS assessment (VA-BCS_OCS), clinically assessed BCS (CA-BCS), and body weight. The lower-left triangle displays the strength of pairwise Spearman’s correlation coefficients using color intensity and circle size, whereas darker and larger circles indicate stronger correlations. The corresponding numerical values of these correlation coefficients are presented in the upper-right triangle. In the CA-BCS column, correlations of VA-BCS scores not significantly different from VA-BCS_OCS are shown in blue (p > 0.05, bootstrap test of two Spearman’s ρ, overlapping case). In the body weight column, correlations of VA-BCS scores not significantly different from CA-BCS are shown in red (p > 0.05). Statistically significant differences are indicated in black with asterisks denoting the level of significance: *p < 0.05; **p < 0.01; ***p < 0.001. This matrix highlights the robustness of visual BCS assessments across scorers and their strong concordance with both CA-BCS and body weight.
Figure 4
Figure 4
Clinical diagnosis shifts in body condition score (BCS) categories based on clinically assessed BCS (CA-BCS) and visual assessments-based BCS (VA-BCS). (A) Bar plot showing the distribution and diagnostic categories of CA-BCS for client-owned cats in the BTS2 dataset: Ideal Weight (IW, BCS 4 ~ 5, blue bars), Overweight (OW, BCS 6 ~ 7, yellow bars), and Obese (OB, BCS 8 ~ 9, orange bars). The percentage of cats (y-axis) is plotted for in each BCS category (x-axis). Arrows in the top panel illustrate potential misclassifications (subpanels B and C) between categories when evaluated through VA-BCS. (B) Horizontal bar plot showing the shifts in clinical diagnosis between CA-BCS and VA-BCS, highlighting transitions between IW and OW/OB categories. Bars represent the percentage of cats with no diagnostic change (gray) or shifts in diagnosis (blue: IW-to-OW/OB, orange: OW/OB-to-IW) for VA-BCS of each evaluator (A ~ I), the majority vote (MV), and the original clinical scorer (OCS). (C) Horizonal bar plot showing the shifts in clinical diagnosis between CA-BCS and VA-BCS, highlighting transitions between IW and OB categories. Bars represent the percentage of cats with no diagnostic change (gray) or shifts in diagnosis (blue: IW-to-OB, orange: OB-to-IW) for VA-BCS of each evaluator (A ~ I), the majority vote (MV), and the original clinical scorer (OCS).
Figure 5
Figure 5
Variability of visual assessments-based body condition scores (VA-BCS) in duplicated image pairs from the BTS2 dataset. (A) VA-BCS and majority vote for duplicated pair 1 (Images #4 and #33) from a female calico cat with a clinically assessed BCS (CA-BCS) of 5 and a body weight (BW) of 4.72 kilograms (kg). Scorer B is the Original Clinical Scorer (OCS). Individual Scorers A ~ I performed VA-BCS assessments, as shown in the table. Image #4 received a majority vote of 5, consistent with the CA-BCS and VA-BCS_OCS. In contrast, Image #33 scored slightly higher, with a majority vote of 6 and a VA-BCS_OCS of 6. The side-view image for Image #33 highlights a broader body profile, which may account for the higher VA-BCS scores compared to Image #4. (B) VA-BCS and majority vote for duplicated pair 1 (Images #11 and #23) from a male black cat with a CA-BCS of 9 and a BW of 9.21 kg. Scorer C is the OCS. Individual Scorers A ~ I performed VA-BCS assessments, as shown in the table. Image #11 received a majority vote of 7 and a VA-BCS_OCS of 6, which was lower than the CA-BCS of 9, suggesting an underestimation. Conversely, Image #23 achieved both a majority vote and a VA-BCS_OCS of 8, closely aligning with the CA-BCS. The differences in scoring between these images may be attributed to variations in the side-view angles. Image #11 depicts the cat in a bent posture, which obscures the visibility of abdominal fat deposits, potentially leading to an underestimation of BCS. In contrast, Image #23 provides a clearer side profile that better highlights the characteristic “small head syndrome” commonly observed in obese cats, resulting in a more accurate assessment of BCS.

Similar articles

References

    1. Magkos F, Sorensen TIA, Raubenheimer D, Dhurandhar NV, Loos RJF, Bosy-Westphal A, et al. On the pathogenesis of obesity: causal models and missing pieces of the puzzle. Nat Metab. (2024) 6:1856–65. doi: 10.1038/s42255-024-01106-8 - DOI - PubMed
    1. German AJ. The growing problem of obesity in dogs and cats. J Nutr. (2006) 136:1940S–6S. doi: 10.1093/jn/136.7.1940S - DOI - PubMed
    1. German AJ, Woods GR, Holden SL, Brennan L, Burke C. Dangerous trends in pet obesity. Vet Rec. (2018) 182:25. doi: 10.1136/vr.k2 - DOI - PMC - PubMed
    1. Ohlund M, Palmgren M, Holst BS. Overweight in adult cats: a cross-sectional study. Acta Vet Scand. (2018) 60:5. doi: 10.1186/s13028-018-0359-7 - DOI - PMC - PubMed
    1. Sandoe P, Palmer C, Corr S, Astrup A, Bjornvad CR. Canine and feline obesity: a one health perspective. Vet Rec. (2014) 175:610–6. doi: 10.1136/vr.g7521 - DOI - PubMed

LinkOut - more resources