

Decrease and recovery of integrated information Φ during anesthesia and sleep on human functional magnetic resonance imaging
- PMID: 40901488
- PMCID: PMC12401003
- DOI: 10.1093/nc/niaf024
Decrease and recovery of integrated information Φ during anesthesia and sleep on human functional magnetic resonance imaging
Abstract
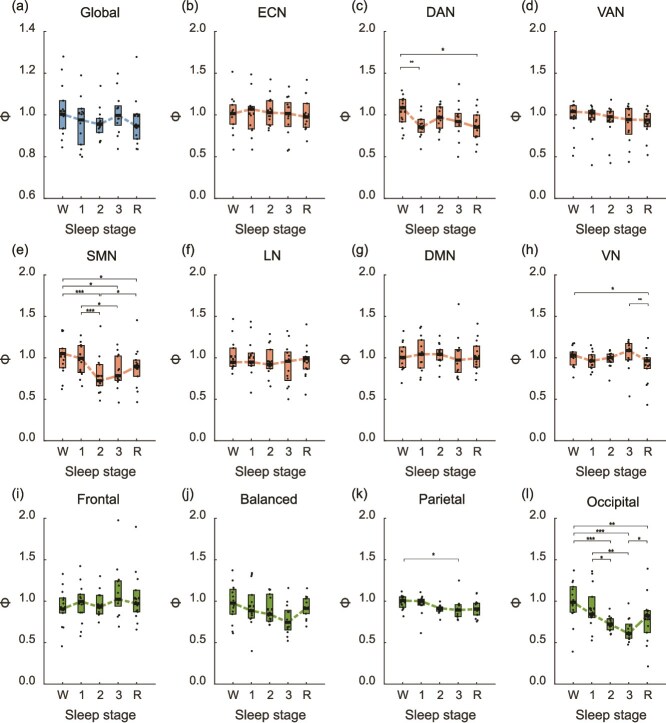
Integrated information theory (IIT) offers an axiomatic framework based on phenomenological properties, allowing the quantification and characterization of consciousness through a measure known as Φ. According to IIT, Φ reflects the level of consciousness and is expected to decrease with loss of consciousness, although empirical data supporting this claim remain limited. In this study, we analyzed two functional magnetic resonance imaging (fMRI) datasets acquired during anesthesia (propofol-induced) and natural sleep to determine whether Φ changes with the loss and recovery of consciousness. Our analysis was conducted using the fourth version of IIT. We constructed systems composed of five functional brain networks, computed transition probability matrices from fMRI time series data, and derived Φ values based on these matrices. As predicted by IIT, Φ decreased during anesthesia-induced loss of consciousness at both global and local levels. Similarly, Φ was locally reduced within a system centered on posterior brain regions during sleep-induced loss of consciousness. Considering functional networks as system units, we found that the integrated information (Φ) of the brain is linked to fluctuations in consciousness levels. These findings indicate a strong association between consciousness and integrated information within the large-scale functional networks.
Keywords: anesthesia; fMRI; integrated information theory; sleep.
© The Author(s) 2025. Published by Oxford University Press.
Conflict of interest statement
None declared.
Figures


Similar articles
-
Prescription of Controlled Substances: Benefits and Risks.2025 Jul 6. In: StatPearls [Internet]. Treasure Island (FL): StatPearls Publishing; 2025 Jan–. 2025 Jul 6. In: StatPearls [Internet]. Treasure Island (FL): StatPearls Publishing; 2025 Jan–. PMID: 30726003 Free Books & Documents.
-
Wakefulness can be distinguished from general anesthesia and sleep in flies using a massive library of univariate time series analyses.PLoS Biol. 2025 Jul 10;23(7):e3003217. doi: 10.1371/journal.pbio.3003217. eCollection 2025 Jul. PLoS Biol. 2025. PMID: 40638578 Free PMC article.
-
Short-Term Memory Impairment.2024 Jun 8. In: StatPearls [Internet]. Treasure Island (FL): StatPearls Publishing; 2025 Jan–. 2024 Jun 8. In: StatPearls [Internet]. Treasure Island (FL): StatPearls Publishing; 2025 Jan–. PMID: 31424720 Free Books & Documents.
-
Intravenous versus inhalational maintenance of anaesthesia for postoperative cognitive outcomes in elderly people undergoing non-cardiac surgery.Cochrane Database Syst Rev. 2018 Aug 21;8(8):CD012317. doi: 10.1002/14651858.CD012317.pub2. Cochrane Database Syst Rev. 2018. PMID: 30129968 Free PMC article.
-
Pharmacotherapies for sleep disturbances in dementia.Cochrane Database Syst Rev. 2016 Nov 16;11(11):CD009178. doi: 10.1002/14651858.CD009178.pub3. Cochrane Database Syst Rev. 2016. Update in: Cochrane Database Syst Rev. 2020 Nov 15;11:CD009178. doi: 10.1002/14651858.CD009178.pub4. PMID: 27851868 Free PMC article. Updated.
References
LinkOut - more resources
Full Text Sources
Research Materials