. 2025 Sep 5;11(36):eadt5859.
doi: 10.1126/sciadv.adt5859. Epub 2025 Sep 3.

Galectin-3 induces neurodevelopmental apical-basal polarity and regulates gyrification

Affiliations

Galectin-3 induces neurodevelopmental apical-basal polarity and regulates gyrification

Luana Campos Soares et al. Sci Adv. .

Abstract

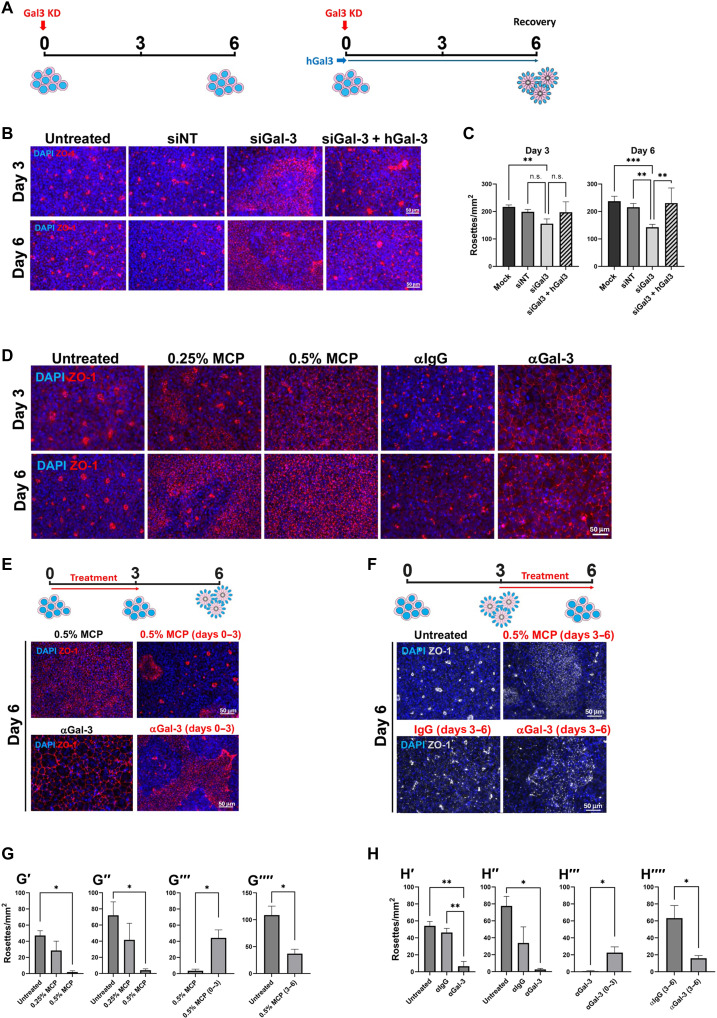
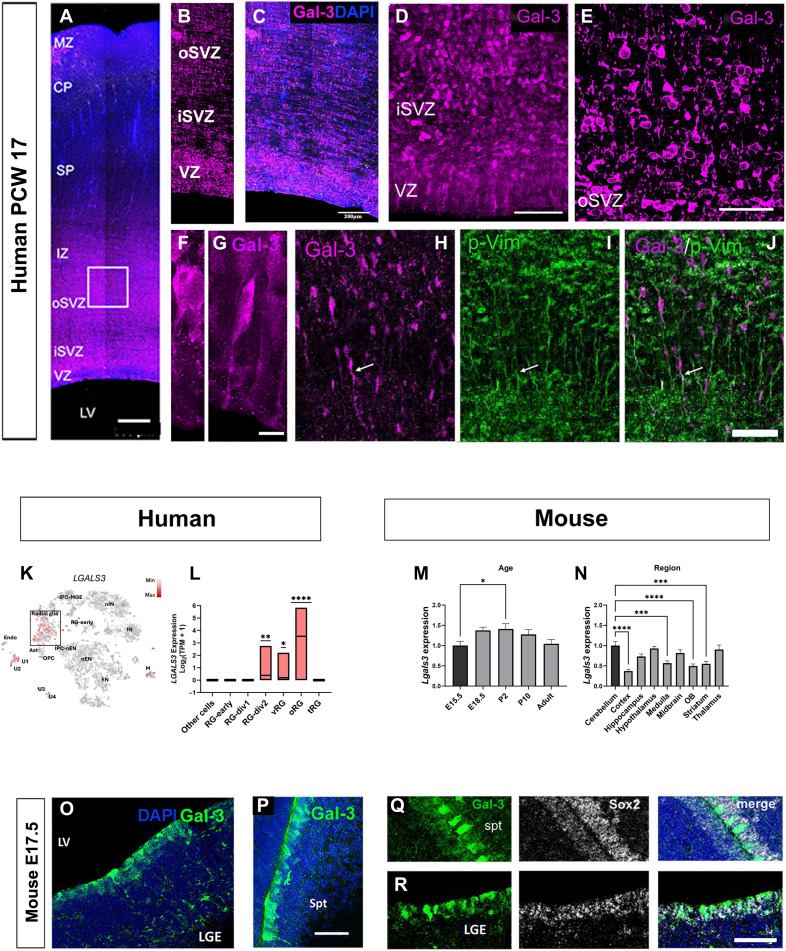
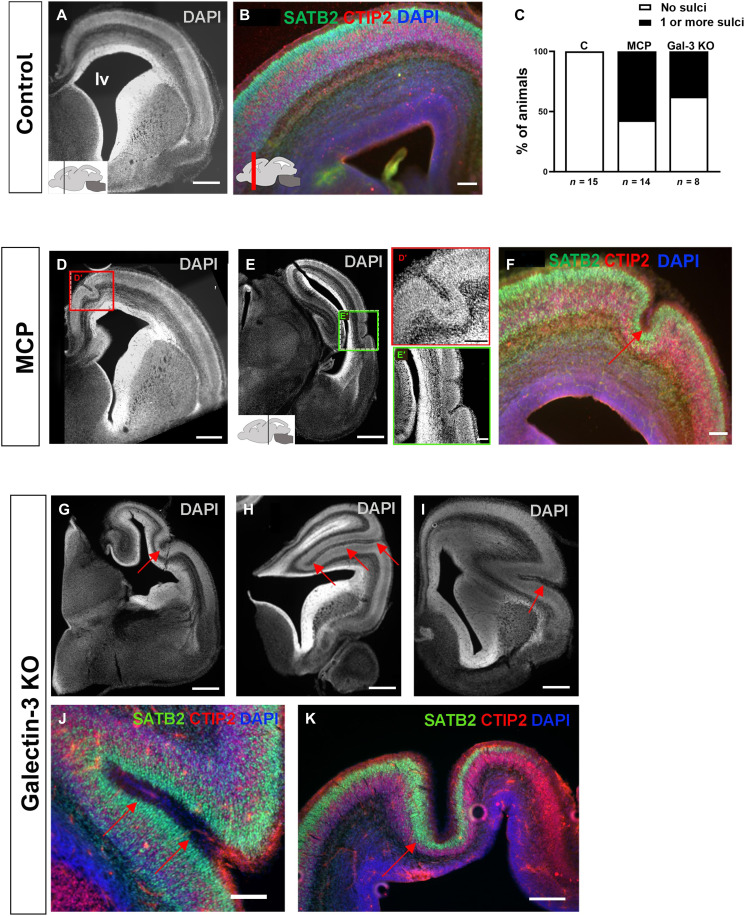
Apical-basal polarity (ABP) establishment and maintenance is necessary for proper brain development, yet how it is controlled is unclear. Galectin-3 (Gal-3) has been previously implicated in ABP of epithelial cells, and, here, we find that it is apically expressed in human embryonic stem cells (hESCs) during neural induction. Gal-3 blockade disrupts ABP and alters the distribution of junctional proteins in hESC-derived neural rosettes and is rescued by addition of recombinant Gal-3. Transcriptomics analysis shows that blocking Gal-3 regulates expression of genes responsible for nervous system development and cell junction assembly, among others. Last, Gal-3 blockade during embryonic development in vivo reduces horizontal cell divisions, disturbs cortical layering of neural progenitors, and induces gyrification. These data uncover a regulatory mechanism for ABP in the brain and warrant caution in modulating Gal-3 during pregnancy.


Figures

Fig. 1.
Fig. 1.. Gal-3 is apically expressed in hESC during neural rosette formation.
(A) Schematic of neural rosettes formation in neural induction medium (NIM). Cells progressively acquired ABP until neural rosettes containing a lumen are observed at day 6. (B) Immunostaining of ZO-1 and F-actin proteins in hESCs over neural induction days until neural rosettes are observed at day 6. Confocal single optical section. Scale bar, 15 μm, for all panels. (C) Immunocytochemistry of Gal-3 in hESCs over neural induction days until full neural rosettes are formed at day 6. Confocal single optical section. Scale bar, 50 μm, applies to all panels. (D) Higher magnification images showing Gal-3 and ZO-1 in human NSCs (hNSCs) at day 6 of neural induction. Schematic showing the details of Gal-3’s speckled distribution and its colocalization with ZO1. Scale bar, 5 μm, in both panels. (E) Confocal z-projections of double immunocytochemistry of Gal-3 and Rab11 in day 6 hNSCs and quantification of the Manders coefficient indicating the portion of Gal-3 particles colocalized with different vesicles, and the portion of vesicles colocalized with Gal-3. Note the extensive Rab11 colocalization. Scale bars, 10 μm. (F) Super-resolution images of triple-positive EVs using an ONI NanoImager. As detected with immunocytochemistry, Gal-3 was colocalized with EVs (pan-EV and tetraspanin) at different time points. Higher magnification images show the details of one single triple-positive EV. Scale bars, 10 μm and 100 nm.
Fig. 2.
Fig. 2.. Disruption of neural rosettes by Gal-3 blockers is dynamic and reversible.
(A) Schematics of the effects of Gal-3 KD (red arrow) and rescue with hrGal-3 (blue arrow, right). (B) Neural rosettes density (ZO-1 circles) at days 3 and 6. hESCs were either not transfected at day 0 (untreated control) or transfected with a nontargeting siRNA (siNT) or siGal-3. The rescue group received hrGal-3 (1 μg/ml) daily in the medium from days 0 to 6. Scale bars, 50 μm. (C) Quantification of (B). Graphs are means with SEM; n = 9 replicates (technical and biological). Two-way analysis of variance (ANOVA) followed by Tukey’s multiple comparisons test. **P < 0.01; ***P < 0.001; n.s., nonsignificant. (D) Neural rosettes density upon treatment with MCP or αGal-3, compared to untreated controls and control antibody αIgG, respectively. Scale bar, 50 μm. (E) MCP or αGal-3 treatment until day 3 (red arrow) led to a recovery in density of neural rosettes at day 6. Scale bar, 50 μm. (F) MCP or αGal-3 treatment from day 3 (red arrow) abolished already formed neural rosettes. Scale bars, 50 μm. (G) Quantification of MCP effects in (D) to (F). (G′) (day 3) and (G″) (day 6) are quantification of (D), and significance was assessed using a two-way ANOVA followed by Tukey’s multiple comparisons test. (G‴) (day 6) and (G⁗) (day 6) are quantification of (E) and (F), and significance was assessed using an unpaired t test. Graphs are means with SEM; n = 3 biological replicates; *P < 0.05. (H) Quantification of αGal-3 effects in (D) to (F). (H′) (day 3) and (H″) (day 6) are quantification of (D), and significance was assessed using a two-way ANOVA followed by Tukey’s multiple comparisons test. (H‴) (day 6) and (H⁗) (day 6) are quantification of (E) and (F), and significance was assessed using an unpaired t test. Graphs are means with SEM; n = 3 biological replicates; *P < 0.05; **P < 0.01.
Fig. 3.
Fig. 3.. Gal-3 regulates distribution of junctional proteins.
(A) Apical distribution of N-cadherin observed via immunocytochemistry at day 6 is disrupted upon treatment with MCP and αGal-3 since day 0. Arrows indicate apical region of fully formed neural rosettes. Arrowheads indicate redistribution of N-cadherin. Scale bar, 50 μm. (B) Apical distribution of Arl13-B observed via immunocytochemistry at day 6 is disrupted upon treatment with MCP and αGal-3 since day 0. Arrows indicate apical region of neural rosettes. Arrowheads indicate redistribution of Arl13-B. Scale bar, 50 μm. (C) Immunocytochemistry for Par3 reveals that its apical localization is disrupted upon treatment with MCP from days 0 to 6 or from days 3 to 6. In contrast, stopping the treatment with αGal-3 at day 3 allowed recovery of apical localization of Par3 at day 6. Arrows indicate apical region of fully formed neural rosettes. Arrowheads indicate redistribution of Par3. Scale bar, 50 μm. (D) Immunocytochemistry for Notch shows apical localization in controls and loss of this pattern after MCP and αGal-3 (compared with αIgG control). Scale bar, 50 μm. (E) Immunocytochemistry for Rab11 shows apical localization in controls and loss of this pattern after MCP and αGal-3 (compared with αIgG control). Scale bar, 50 μm. (F) Orthogonal views of tight and adherens junction proteins ZO-1, Par3, and N-cadherin in untreated and 0.5% MCP-exposed hESCs at day 6 of neural induction. Note that their expression is quite specifically localized to the apical poles of rosettes. After rosette disruption by the Gal-3 blocker MCP, these proteins moved toward the basolateral domain within the cells. Schematics on the right show the redistribution of TJ and AJ proteins after Gal-3 block. TJ, tight junctions; AJ, adherens junctions. Scale bars, 10 μm.
Fig. 4.
Fig. 4.. RNA-seq reveals developmental genes regulated by Gal-3.
(A) Volcano plot of genes differentially expressed (FDR < 0.05) in MCP-treated versus control hNSCs at days 3 and 6 of neural induction. A subset of genes significantly up-regulated [Log2(fold change) > 0.5] is shown. (B) Venn diagram representing the number of genes differentially expressed in MCP versus control groups and the overlap between different days. (C) Gene Ontology (GO)–biological processes enrichment analysis of genes up-regulated in MCP versus control group at days 3 and 6. (D) Kyoto Encyclopedia of Genes and Genomes (KEGG) pathways enrichment analysis of genes up-regulated and down-regulated in MCP versus control group at days 3 and 6. MAPK, mitogen-activated protein kinase; TNF, tumor necrosis factor; PI3K, phosphatidylinositol 3-kinase.
Fig. 5.
Fig. 5.. Gal-3 is expressed in human and murine embryonic NSC.
(A to J) Gal-3 expression was analyzed via immunohistochemistry in coronal sections of a postconception week (PCW) 17 human embryonic brain. MZ, marginal zone; CP, cortical plate; SP, subplate; IZ, intermediate zone; oSVZ, outer subventricular zone; iSVZ, inner subventricular zone; VZ, ventricular zone; LV, lateral ventricle. (A) Robust Gal-3 expression was observed in the VZ, iSVZ, oSVZ, and IZ layers. Scale bar, 500 μm. (B and C) Details of Gal-3 immunohistochemistry in the VZ, iSVZ, and oSVZ. Scale bar, 200 μm. (D) Gal-3 expression in the VZ and iSVZ, confocal z-stack projection. Scale bar, 100 μm. (E) Gal-3 expression in the oSVZ, single optical section. Scale bar, 20 μm. (F and G) Higher magnification showing Gal-3–positive VZ cells with ABP, with apical process evident, and RG-like morphology. Scale bar, 10 μm. (H to J) The oSVZ showing Gal-3–positive and p-Vimentin (p-Vim)–positive RG fibers (arrow) and migrating neuroblasts. Scale bar, 50 μm. (K) tSNE plot showing LGALS3 gene expression from scRNA-seq in radial progenitor populations (oRG, vRG, and RG-div2) across stages of human embryonic cortical neurogenesis. Generated using UCSC Cell Browser (61). Cell type clusters are annotated. Clusters RG-div1, RG-div2, oRG, vRG and tRG are boxed. PC-MGE, intermediate progenitors of medial ganglionic eminence; IPC-nEN, intermediate progenitors of newborn excitatory neurons; nIN, newborn interneurons; IN, interneurons; nEN, newborn excitatory neurons; EN, excitatory neurons; M, microglia; Ast, astrocytes; OPC, oligodendrocyte progenitors; Endo, endothelial cells; RG-early, Early radial glial cells; RG-div1 and 2, dividing radial glial cells cluster 1 and 2; oRG, outer radial glial cells; tRG, truncated radial glial cells. (L) Human LGALS3 enrichment measure in transcript per million (TPM) + 1. Graph bar is minimum to maximum, and line represents mean. Wilcoxon’s rank sum test. *P < 0.05; **P < 0.01; ****P < 0.0001. (M and N) PCR showing murine Lgals3 expression in different ages (M) and across regions (N). Fold change values were calculated relative to left-most columns. Graphs show mean with SEM. N = 3 for each region except for cerebellum P10 (N = 2) and midbrain E18 (N = 2) and midbrain P2. Ordinary one-way ANOVA followed by Dunnett’s multiple comparison test was used for statistical analysis. *P ≤ 0.05, ***P ≤ 0.001, ****P < 0.0001. (O and P) Gal-3 expression in E17.5 mouse lateral ganglionic eminence (LGE) (O) and septum (Spt) (P). LV, lateral ventricle. Scale bar, 50 μm. (Q and R) Gal-3 is expressed in Sox2+ cells lining the lateral ventricles. Scale bar, 50 μm.
Fig. 6.
Fig. 6.. Gal-3 inhibition leads to sulci formation in E17.5 mice embryos.
(A) DAPI staining of control coronal hemi-sections at an anterior level. Note the smoothness of the cortical surface. lv, lateral ventricle. Scale bar, 500 μm. (B) Control cerebral cortex at an anterior level with immunohistochemistry for Satb2 and Ctip2. Scale bar, 100 μm. (C) Quantification of the percentage of embryos displaying sulci in all litters studied (two litters per group). Quantification showed that controls had no sulci. (D) Anterior level coronal hemi-section from an embryo exposed to MCP. DAPI staining of MCP-treated embryos at similar anterior posterior level as (A) showing representative sulcus (red box). Box shown at higher magnification in (D′). Scale bar, 500 μm. (D′) 100 μm. (E) Posterior level coronal hemisection showing two adjacent sulci in an MCP-treated embryo. Green box shown at higher magnification in (E′). Scale bar, 500 μm. (E′) 100 μm. (F) Satb2 and Ctip2 immunohistochemistry with a typical sulcus (red arrow). Scale bar, 100 μm. (G) A Gal-3−/− embryo with a typical sulcus. Scale bar, 100 μm. (H) Gal-3−/− embryo with a deep sulcus (red arrows). Scale bar, 100 μm. (I) A Gal-3−/− embryo with an intermediate depth sulcus (red arrow). Scale bar, 100 μm. (J) Satb2 and Ctip2 immunohistochemistry of the sulcus shown in (J). Scale bar, 400 μm. (K) Gal-3−/− embryo sulcus (red arrow) stained for Satb2 and Ctip2. Note that it almost reached the VZ. Scale bar, 400 μm.
Fig. 7.
Fig. 7.. Gal-3 inhibition in the developing cortex: disrupted ABP, increased vertical cell division, and delamination from apical surface.
(A) Representative image showing ZO1 immunohistochemistry in the pallial VZ lining the lateral ventricle (LV). Anterior cerebral cortex, coronally sectioned. Arrows indicate the thickness of the apical VZ region, which is much expanded after MCP treatment. Note also that blood vessels (BV) are ZO1+. Scale bars, 50 μm. (B) Quantification of thickness of apical region of control and MCP-treated E17.5 mice embryos in anterior sections. Graphs are represented as means with SEM; n = 6. Mann-Whitney test; **P < 0.001. (C) Representative image of DAPI staining of mouse E17.5 brain sections. Square on the left image shows enlarged area on the right images. The red lines show the angle between the cortex-lateral ventricle border and the cleavage plane of neural progenitors in anaphase. Scale bar, 350 μm. (D) Distributions of cleavage plane angles in separate control and MCP-treated E17.5 embryos. Graphs are represented as means with SEM; n = 3. Mann-Whitney test; ***P < 0.001. (E) Quantification of percentage of vertical cell divisions in control and MCP-treated embryos. Vertical cell divisions were classified as anaphases with a cleavage plane angle of less than 60°. Graphs are represented as means with SEM; n = 3. Mann-Whitney test; ***P < 0.001. (F) Representative images of Pax6+Ki67+ immunohistochemistry and Tbr2+Ki67+ immunohistochemistry. Images are from anterior cortex in control and MCP-treated E17.5 embryos. Arrows point toward example of PAX6+Ki67+ and Tbr2+Ki67+ double-positive cells. Overlapping expression shown in high magnification panels on the right. Scale bars, 50 μm. (G) Quantification of number of PAX6+, PAX6+Ki67+, Tbr2+, and Tbr2+Ki67+ cells per square millimeter in anterior coronal sections. Graphs are represented as means with SEM; n = 4. Unpaired t test; *P < 0.05.
Fig. 8.
Fig. 8.. The effects of Gal-3 inhibition on ABP in neural embryonic development.
Blocking Gal-3 in vitro resulted in disruption of the polarization of the neural epithelium, as evidenced by a decrease in the number of neural rosettes. In vivo, disruption of ZO1 could be observed around the VZ of E17.5 mouse embryos upon Gal-3 inhibition. The number of vertical cell divisions increased, and more Pax6+Ki67+ cells were found in the intermediate zone, indicating delamination of oRG. Last, sulci were observed in MCP and Gal-3 KO mice. TJ, tight junctions; CP, cortical plate; SP, subplate; IZ, intermediate zone; V-SVZ, ventricular-subventricular zone; aRGs, apical radial glia; oRG, outer radial glial.

References

    1. Buckley C. E., St Johnston D., Apical-basal polarity and the control of epithelial form and function. Nat. Rev. Mol. Cell Biol. 23, 559–577 (2022). - PubMed
    1. Fietz S. A., Huttner W. B., Cortical progenitor expansion, self-renewal and neurogenesis-a polarized perspective. Curr. Opin. Neurobiol. 21, 23–35 (2011). - PubMed
    1. Del-Valle-Anton L., Borrell V., Folding brains: From development to disease modeling. Physiol. Rev. 102, 511–550 (2022). - PubMed
    1. Akula S. K., Exposito-Alonso D., Walsh C. A., Shaping the brain: The emergence of cortical structure and folding. Dev. Cell 58, 2836–2849 (2023). - PMC - PubMed
    1. Hevner R. F., From radial glia to pyramidal-projection neuron: Transcription factor cascades in cerebral cortex development. Mol. Neurobiol. 33, 33–50 (2006). - PubMed

LinkOut - more resources