. 2025 Sep 9;58(9):2176-2189.e3.
doi: 10.1016/j.immuni.2025.08.005. Epub 2025 Sep 2.

Tolerance to non-inherited maternal antigen is sustained by LysM+ CD11c+ maternal microchimeric cells

Affiliations

Tolerance to non-inherited maternal antigen is sustained by LysM+ CD11c+ maternal microchimeric cells

Yanyan Peng et al. Immunity. .

Abstract

Maternal-fetal microchimerism is increasingly linked with both inflammatory disorders and immune tolerance phenotypes. However, finding microchimeric cells in target tissues does not establish causality, which require platforms for manipulating these rare and heterogeneous cells. Here, we studied maternal microchimeric cells (MMc) that sustain non-inherited maternal antigen (NIMA) tolerance. Complete MMc depletion overturned hallmark features of NIMA-specific tolerance including FOXP3+ regulatory T cell expansion and cross-generational resiliency against fetal wastage. Stepwise depletion of individual MMc subsets showed that NIMA-specific tolerance is sustained exclusively by microchimerism in maternal LysM+ CD11c+ Vav1+ leukocyte cells. Interestingly, conditional depletion of these tolerogenic cells does not diminish overall MMc levels, dissociating NIMA-specific tolerance from MMc persistence. Thus, tolerance to maternal alloantigens is maintained by only a small fraction of MMc identified by LysM and CD11c co-expression, with persistence of remaining MMc highlighting remarkable adaptation to allogeneic maternal cells acquired in this early-life developmental context.

Keywords: immune tolerance; microchimerism; non-inherited maternal antigen; regulatory T cell; transplantation.


Conflict of interest statement

Declaration of interests The authors declare no competing interests.

Figures
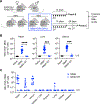
Figure 1.
Figure 1.. Sustained MMc depletion in offspring born to dams with βactinCre-induced DTR expression
(A) Schematic for generating mice containing βactinCre+/− R26iDTR+/− OVA:2W1S+/− maternal cells susceptible to DT-induced depletion, and timeline for DT treatment initiated in 6–8 week old mice. (B) OVA+ DNA genomic equivalents (GEq) specific to OVA:2W1S+ MMc in each tissue of NIMA-OVA:2W1S mice without DT (blue filled) or 2 weeks (14 days) after initiating every other day DT treatment (blue open) compared with naive control mice (black). (C) OVA+ DNA genomic equivalents (GEq) specific to OVA:2W1S+ MMc in each tissue of NIMA-OVA:2W1S mice without DT (blue filled) or 4 weeks (28 days) from last DT administration. Each point indicates the data from an individual mouse, combined from at least two independent experiments each containing 4–6 mice per group with similar results. ***P < 0.005, ****P < 0.001 (Kruskal-Wallis one way ANOVA test); Bar, mean ± SEM; ns, not significant. Dotted line, limits of detection (LoD). See also Figure S1.
Figure 2.
Figure 2.. DT-induced MMc depletion overrides NIMA-specific Treg cell expansion and resiliency against prenatal infection.
(A) Representative FACS plots and composite data showing percent FOXP3+ among CD4+ T cells with I-Ab:2W1S specificity, and number of 2W1S tetramer positive CD4+ T cells in secondary lymphoid organs (spleen + peripheral lymph nodes) for OVA:2W1S−/− (NIMA-OVA:2W1S) mice born to βactinCre+/− R26iDTR+/− OVA:2W1S+/− dams without DT (blue filled) or 14 days after initiating every other day DT treatment (blue open) compared with naive control mice (black). (B) Schematic for generating mice containing H2b/d βactinCre+/− R26iDTR+/− OVA:2W1S+/− maternal cells susceptible to DT induced depletion, DT administration timeline relative to mating with H2d/d BALB/c males and Lm prenatal infection, percent fetal wastage, average recoverable CFUs from concepti in each litter, and number live concepti per litter five days after Lm infection for NIMA-H2d mice without DT (blue filled) or after DT treatment (blue open), compared with naive control mice (black). Each point indicates the data from an individual mouse, combined from at least two independent experiments each containing 4–6 mice per group with similar results. **P < 0.01, ***P < 0.005, ****P < 0.001 (standard one way ANOVA test); Bar, mean ± SEM; ns, not significant. See also Figures S1, S2, S3, S4 and S5.
Figure 3.
Figure 3.. Microchimerism in maternal Vav1+ leukocytes sustain NIMA-specific tolerance
(A) Schematic for generating NIMA-OVA:2W1S mice containing Vav1Cre+/− H2b/d R26iDTR+/− OVA:2W1S+/−, K14Cre+/− H2b/d R26iDTR+/− OVA:2W1S+/−, or Cdh5Cre+/− H2b/d R26iDTR+/− OVA:2W1S+/− maternal cells susceptible to DT induced depletion. Percent FOXP3+ among CD4+ T cells with I-Ab:2W1S specificity in pooled secondary lymphoid organs for NIMA-OVA:2W1S mice without DT (blue filled), 14 days after initiating every other day DT treatment (blue open), or naive control mice (black). (B) Schematic for generating NIMA-H2d mice containing Vav1Cre+/− H2b/d R26iDTR+/− OVA:2W1S+/−, K14Cre+/− H2b/d R26iDTR+/− OVA:2W1S+/−, or Cdh5Cre+/− H2b/d R26iDTR+/− OVA:2W1S+/− maternal cells susceptible to DT induced depletion. Percent fetal wastage, and number live concepti per litter five days after Lm infection for NIMA-H2d mice without DT (blue filled) or after DT treatment (blue open), compared with naive control mice (black). Each point indicates the data from an individual mouse, combined from at least two independent experiments each containing 4–6 mice per group with similar results. **P < 0.01, ***P < 0.005, ****P < 0.001 (standard one-way ANOVA test panel A; Kruskal-Wallis one way ANOVA test, panel B); Bar, mean ± SEM; ns, not significant. See also Figure S5.
Figure 4.
Figure 4.. Microchimerism in MHC class II expressing hCD2+ lymphocytes dispensable for NIMA-specific tolerance
(A) Representative FACS plots showing gating scheme and distribution of I-Ab MHC class II expressing CD45+ leukocyte cells in the spleen and liver. (B) Schematic for generating NIMA-OVA:2W1S mice containing hCD2Cre+/− H2b/d R26iDTR+/− OVA:2W1S+/− maternal cells susceptible to DT induced depletion. Percent FOXP3+ among CD4+ T cells with I-Ab:2W1S specificity in pooled secondary lymphoid organs of NIMA-OVA:2W1S mice without DT (blue filled) or after DT treatment (blue open), compared with naive control mice (black). (C) Schematic for generating NIMA-H2d mice containing hCD2Cre+/− H2b/d R26iDTR+/− OVA:2W1S+/− maternal cells susceptible to DT induced depletion, percent fetal wastage, average recoverable CFUs from concepti in each litter, and number live pups per litter five days after Lm prenatal infection for NIMA-H2d mice without DT (blue filled) or after DT treatment (blue open), compared with naive control mice (black). ****P < 0.001 (standard one way ANOVA test panel B; Kruskal-Wallis one way ANOVA test, panel C). SSC-A, side scatter area. Bar, mean ± SEM; ns, not significant. See also Figures S5 and S6.
Figure 5.
Figure 5.. LysM+ and CD11c+ MMc essential for NIMA-specific tolerance
(A) Schematic for generating NIMA-OVA:2W1S mice containing LysMCre+/− H2b/d R26iDTR+/− OVA:2W1S+/− or CD11cCre+/− H2b/d R26iDTR+/− OVA:2W1S+/− maternal cells susceptible to DT induced depletion. Percent FOXP3+ among CD4+ T cells with I-Ab:2W1S specificity in pooled secondary lymphoid organs for NIMA-OVA:2W1S mice without DT (blue filled) or after DT treatment (blue open), compared with naive control mice (black). (B) Schematic for generating NIMA-H2d mice containing LysMCre+/− H2b/d R26iDTR+/− OVA:2W1S+/− or CD11cCre+/− H2b/d R26iDTR+/− OVA:2W1S+/− maternal cells susceptible to DT-induced depletion. Percent fetal wastage, average recoverable CFUs from concepti in each litter, and number live concepti per litter five days after Lm infection for NIMA-H2d mice without DT treatment (blue filled) or after DT treatment (blue open), compared with naive control mice (black). Each point indicates the data from an individual mouse, combined from at least two independent experiments each containing 4–6 mice per group with similar results. *P < 0.05, **P < 0.01, ***P < 0.005 (standard one way ANOVA test panel A; Kruskal-Wallis one way ANOVA test, panel B); Bar, mean ± SEM; ns, not significant. See also Figure S5.
Figure 6.
Figure 6.. Validating MMc depletion in offspring born to dams with hCD2Cre-induced DTR expression
(A) Experimental schematic and representative FACS plots showing liver leukocyte cells before and after sorting for B220+ CD45+ B lymphocytes, CD3+ CD45+ T lymphocytes or B220 CD3 double-negative CD45+ cells from NIMA-OVA:2W1S mice born to hCD2Cre+/− H2b/d R26iDTR+/− OVA:2W1S+/− (hCD2Cre NIMA), LysMCre+/− H2b/d R26iDTR+/− OVA:2W1S+/− (LysMCre NIMA) dams, or naive control mice; and OVA+ DNA genomic equivalents (GEq) specific to OVA:2W1S+ MMc for lymphocytes (B220+ plus CD3+ cells) or B220 CD3 double-negative CD45+ leukocytes for each group of mice without DT (blue filled), 14 days after initiating every other day DT treatment (blue open), or naive control mice (black). (B) OVA+ DNA genomic equivalents (GEq) specific to OVA:2W1S+ MMc among sort purified B220+ B lymphocytes, CD3+ T lymphocytes or B220 CD3 double-negative CD45+ leukocytes for individual mice (connected lines) in each group described in panel A. Each point indicates the data from an individual mouse, combined from at least four independent experiments each containing 2–3 mice per group with similar results. *P < 0.05, **P < 0.01 (Kruskal-Wallis one way ANOVA test). SSC-A, side scatter area. Bar, mean ± SEM; ns, not significant. See also Figure S7.
Figure 7.
Figure 7.. Microchimerism persistence despite loss of LysM+ CD11c+ microchimeric leukocytes essential for NIMA-specific tolerance
(A) OVA+ DNA genomic equivalents (GEq) specific to OVA:2W1S+ MMc in each tissue of OVA:2W1S−/− (NIMA-OVA:2W1S) mice born to Cdh5Cre+/− R26iDTR+/−, hCD2Cre+/− R26iDTR+/−, Vav1Cre+/− R26iDTR+/−, LysMCre+/− R26iDTR+/−, CD11cCre+/− R26iDTR+/− dams or naive control mice 14 days after initiating every other day DT treatment plotted individually or grouped based on whether NIMA-specific tolerance is erased (star) or sustained (circle). (B) Cartoon illustrating loss of NIMA tolerance induced cross-generational resiliency against fetal wastage after depleting LysM+ CD11c+ MMc does not significantly change overall microchimerism levels. Each point indicates the data from an individual mouse, combined from at least two independent experiments each with similar results. Bar, mean ± SEM. Dotted line, limits of detection. ns, not significant (Kruskal-Wallis one way ANOVA test).

References

    1. Kinder JM, Stelzer IA, Arck PC, and Way SS (2017). Immunological implications of pregnancy-induced microchimerism. Nat Rev Immunol 17, 483–494. 10.1038/nri.2017.38. - DOI - PMC - PubMed
    1. Nelson JL (2012). The otherness of self: microchimerism in health and disease. Trends Immunol 33, 421–427. 10.1016/j.it.2012.03.002. - DOI - PMC - PubMed
    1. Bianchi DW, Khosrotehrani K, Way SS, MacKenzie TC, Bajema I, and O’Donoghue K (2021). Forever Connected: The Lifelong Biological Consequences of Fetomaternal and Maternofetal Microchimerism. Clin Chem 67, 351–362. 10.1093/clinchem/hvaa304. - DOI - PMC - PubMed
    1. Boddy AM, Fortunato A, Wilson Sayres M, and Aktipis A (2015). Fetal microchimerism and maternal health: a review and evolutionary analysis of cooperation and conflict beyond the womb. Bioessays 37, 1106–1118. 10.1002/bies.201500059. - DOI - PMC - PubMed
    1. Comitre-Mariano B, Martinez-Garcia M, Garcia-Galvez B, Paternina-Die M, Desco M, Carmona S, and Gomez-Gaviro MV (2022). Feto-maternal microchimerism: Memories from pregnancy. iScience 25, 103664. 10.1016/j.isci.2021.103664. - DOI - PMC - PubMed

LinkOut - more resources