. 2025 Oct;646(8085):657-666.
doi: 10.1038/s41586-025-09435-8. Epub 2025 Sep 3.

Single-cell transcriptomic and genomic changes in the ageing human brain

Affiliations

Single-cell transcriptomic and genomic changes in the ageing human brain

Ailsa M Jeffries et al. Nature. 2025 Oct.

Abstract

Over time, cells in the brain and in the body accumulate damage, which contributes to the ageing process1. In the human brain, the prefrontal cortex undergoes age-related changes that can affect cognitive functioning later in life2. Here, using single-nucleus RNA sequencing (snRNA-seq), single-cell whole-genome sequencing (scWGS) and spatial transcriptomics, we identify gene-expression and genomic changes in the human prefrontal cortex across lifespan, from infancy to centenarian. snRNA-seq identified infant-specific cell clusters enriched for the expression of neurodevelopmental genes, as well as an age-associated common downregulation of cell-essential homeostatic genes that function in ribosomes, transport and metabolism across cell types. Conversely, the expression of neuron-specific genes generally remains stable throughout life. These findings were validated with spatial transcriptomics. scWGS identified two age-associated mutational signatures that correlate with gene transcription and gene repression, respectively, and revealed gene length- and expression-level-dependent rates of somatic mutation in neurons that correlate with the transcriptomic landscape of the aged human brain. Our results provide insight into crucial aspects of human brain development and ageing, and shed light on transcriptomic and genomic dynamics.


Conflict of interest statement

Competing interests: The authors declare no competing interests.

Figures
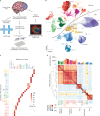
Fig. 1
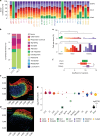
Fig. 1. Study design and characterization of droplet-based snRNA-seq in human PFC.
a, Overall study design. Human PFC was analysed by three single-cell genomic techniques in parallel. b, Dimensional reduction and clustering of all snRNA-seq nuclei after filtration yielded several clusters for each cell type (Ast, astrocyte; CC, cortico-cortico; Endo, endothelial; L, layer; Oli, oligodendrocyte; UMAP, uniform manifold approximation and projection). c, Percentage of nuclei in each cluster of our data that correspond to the annotated reference cluster. d, Gene-expression profiles for each subcluster within a cell type correspond most closely to the cells of the same lineage based on Pearson’s correlation coefficient. The bar plot above the heat map shows the number of genes expressed in each cluster.
Fig. 2
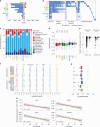
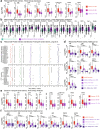
Fig. 2. Changes in the transcriptional state of brain cells across the human lifespan.
a, Clusters plotted by donor contribution as a percentage of total cells in the cluster. L2/3-2 and Ast-3 are composed nearly completely of nuclei from infant donors. b, GO terms derived from differentially expressed genes upregulated in infant-specific clusters plotted as general categories (see Supplementary Table 5 for a full list of terms and category designations). Development-related terms (shades of green) are most common. c,d, MERFISH section from a 0.4-year-old male donor (c) and a 15-year-old female donor (d), showing correct laminar positioning. Circles correspond to excitatory neurons and are coloured according to marker-gene expression (red, CUX2 (L2/3); green, RORB (L4); blue, HS3ST4 (L5/6); yellow, CUX2 and RORB co-expression; teal, RORB and HS3ST4 co-expression). x- and y-axis values reflect pixel positions e, Contribution of OPCs (top) and oligodendrocytes (bottom) to the total nuclei identified in each donor (*P < 0.05). f, Transcriptional variability in IN-SST neurons. Variability significantly increases in neurons from elderly donors. Box plots depict median and first and third quartiles. Whiskers show 1.5 times the interquartile range (IQR) beyond the first and third quartiles (P = 4.30 × 10−2, two-sided Wilcoxon rank-sum test; elderly n = 7, adult n = 9). g, Log2(elderly/adult) fold change plotted for each marker gene. Dot size corresponds to expression in each cell type. Dots circled in black have statistically significant fold changes, meeting our criteria for differential expression.
Fig. 3
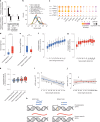
Fig. 3. Common downregulation of genes across cell types.
a, Number of downregulated (blue) and upregulated (red) genes for each cell type in elderly donors. DEGs, differentially expressed genes. b, Heat map of significantly downregulated differentially expressed genes in elderly donors. Genes not differentially expressed are in white. The leftmost genes are defined as common across cell types (down in one or more excitatory, one or more inhibitory and two or more non-neuronal cell types). c, GO terms of genes downregulated in ageing plotted as general categories (see Supplementary Table 8 for full GO results). Housekeeping functions (shades of blue) are commonly downregulated. d, Housekeeping genes are significantly downregulated in elderly relative to adult brains in all neuron types. Boxes show median, first and third quartiles. Whiskers show 1.5 × IQR beyond the first and third quartiles (****P < 0.0001 and fold change < −0.05, two-sided Wilcoxon rank-sum test; elderly n = 7, adult n = 9). e, Mean gene effect score for all of the downregulated (blue) and upregulated (red) genes (in elderly versus adult donors) in the DepMap database. The downregulated genes for both neurons (left) and microglia (right) are more essential than the upregulated genes (two-sided t-test; neurons down n = 1,954, neurons up n = 455, microglia down n = 149, microglia up n = 75; neurons ****P = 7.33 × 10−7, microglia ****P = 9.09 × 10−7). Boxes and whiskers as in d. Points beyond whiskers are outliers. f,g, Fold change in elderly versus adult ribosomal-protein genes from both the small and the large subunit by snRNA-seq (two-sided t-test; elderly n = 7, adult n = 9) (f) and MERFISH (two-sided Wilcoxon rank-sum test; elderly n = 3, adult n = 3) (g). Inb, inhibitory. Genes shown in both f and g are colour-coded. Boxes and whiskers as in e. h, Expression of immediate early genes in excitatory neurons decreases with age. Grey shading, 95% confidence intervals. All data points shown (*P < 0.05, **P < 0.01, ***P < 0.001).
Fig. 4
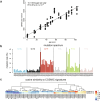
Fig. 4. scWGS reveals sSNV mutational signatures linked to expression.
a, De novo mutational signature analysis of sSNVs in human neurons revealed two signatures: A1 dominated by T>C mutations and A2 dominated by C>T mutations. Trinucleotide contexts are the same as shown in Extended Data Fig. 6c. b, Number of signature A1 sSNVs in each neuron plotted by age. Signature A1 strongly correlates with age (R2 = 0.88, P = 3.30 × 10−50) with an extrapolated mutation rate of 12.1 SNVs per year. c, sSNV enrichment of signature A1 in coding regions plotted by neuron expression quantile (left) and genic versus intergenic regions (right). Signature A1 is enriched in the highest-expressed genes and genic regions (chi-squared test). d, Percentage of total sSNVs derived from the transcribed strand broken down by expression quantile. T>C and C>T strand bias increases with expression (chi-squared test; *multiple-testing-corrected false discovery rate (FDR) < 0.05; **multiple-testing-corrected FDR < 0.01). e, Number of signature A2 sSNVs in each neuron plotted by age. Signature A2 correlates with age (R2 = 0.42, P = 6.60 × 10−14) with an extrapolated mutation rate of 3 SNVs per year. f, sSNV enrichment of signature A2 in coding regions plotted by neuron expression quantile (left) and genic versus intergenic regions (right). Signature A2 is depleted in the highest-expressed genes and enriched in the lowest-expressed genes as well as intergenic regions (*P < 0.05, chi-squared test). g,h, Mutation enrichment in human brain chromatin states for signature A1 (g) and signature A2 (h) (chi-squared test; *P < 0.05, ***P < 0.001, ****P < 0.0001). TssA, active TSS; TssAFlnk, flanking active TSS; TxFlnk, transcription at gene 5′ and 3′; Tx, strong transcription; TxWk, weak transcription; EnhG, genic enhancers; Enh, enhancers; ZNF/Rpts, ZNF genes and repeats; Het, heterochromatin; TssBiv, bivalent or poised TSS; BivFlnk, flanking bivalent TSS or enhancer; EnhBiv, bivalent enhancer; ReprPC, repressed polycomb; ReprPCWk, weak repressed polycomb; Quies, quiescent or low expression.
Fig. 5
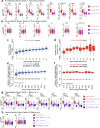
Fig. 5. Gene downregulation during ageing relates to gene size, expression level, gene type and sSNV burden.
a, Mixed-effects linear model identifying determinants of downregulation in excitatory neurons (model performance R2 = 0.54). Gene and exon length positively correlated with ageing-related fold change (FC) in expression. Length-normalized expression in excitatory neurons and frontal cortex expression (GTEx database) negatively correlated with ageing-related fold change. Significance of linear model correlations was determined by two-sided t-test. b, Density plots of the length of downregulated genes (solid lines) and all expressed genes (dashed lines) for each cell type. Mean lengths for downregulated genes are shown; asterisks denote significant differences from the mean neuronal downregulated length (two-sided t-test). c, Expression of topoisomerase complex genes across cell types. Asterisks denote significant differences in the percentage of cells expressing between neurons and non-neurons (two-sided Wilcoxon rank-sum test). d, Housekeeping genes (n = 1,802) are significantly shorter than neuron-specific genes (n = 288) (P = 2.2 × 10−16, two-sided t-test). e, Short (decile 1) housekeeping (n = 180) and neuron-specific (n = 28) genes showed differential expression in adult excitatory neurons (P = 6.5 × 10−4, two-sided t-test). CPKM, counts per kilobase per million. f,g, Fold change (elderly/adult) of housekeeping genes (f) and neuron-specific genes (g) by length decile in excitatory neurons (housekeeping R2 = 0.50, P = 1.35 × 10−281; neuron-specific R2 = 0.20, P = 1.24 × 10−3; elderly n = 7, adult n = 9). h, Fold change in the expression of the indicated gene sets in excitatory neurons, from MERFISH data (P = 3.4 × 10−5, two-sided Wilcoxon rank-sum test; elderly n = 3, adult n = 3). i,j, The sSNV rate per base pair negatively correlates with gene length in housekeeping genes (R2 = 0.44, P = 3.52 × 10−2, Pearson’s correlation) (i), but not in neuron-specific genes (R2 = 0.02) (j). Simple linear model trend line with grey 95% confidence intervals shown. k, The relationship between gene length (black arrow), mRNA expression (blue and red), and mutations (yellow) identified in this work. *P < 0.05, **P < 0.01, ***P < 0.001, ****P < 0.0001. All box plots depict median and first and third quartiles. Whiskers show 1.5 × IQR beyond the first and third quartiles.
Extended Data Fig. 1
Extended Data Fig. 1. Cell-type ratios do not change significantly with age.
(a) Neuron to glia ratio shows no significant change with age. (b) Excitatory to inhibitory neuron ratio shows no significant change with age. (c) Contribution of each cell type to each donor, shown as a percentage of total cells. Columns in this panel plus Fig. 2b sum to 100. (d) We see no significant differences between elderly and adult in the proportion of inhibitory neuron subtypes. (IN – inhibitory neurons, AST – astrocytes, Endo – endothelial cells).
Extended Data Fig. 2
Extended Data Fig. 2. Marker-gene expression in infant-specific neurons.
UMAP shows cell-type prediction score for each cell on the plot. Prediction scores shown for L2/3 neurons, L4 neurons, L5/6 neurons, L5/6-CC neurons, and Neu-mat neurons, a cell type identified in our reference data thought to be a mix of ambient RNA and maturing neurons. The infant-specific neuron cluster is circled in red and shows mixed cell-type composition based on prediction scores. Neuron prediction scores otherwise show cluster-specific patterning.
Extended Data Fig. 3
Extended Data Fig. 3. Cortical layers in MERFISH data.
MERFISH sections of infant male, 15-year-old female, 28-year-old male, and 57-year-old male individuals showing marker-gene expression for cortical layers. Circles represent excitatory neurons coloured by gene expression. (a,b) Red: CUX2-L2/3; Green: RORB-L4; Yellow: CUX2 and RORB co-expression. (b) Blue: HS3ST4-L5/6; Teal: RORB and HS3ST4 co-expression. X- and Y-axis values reflect pixel positions.
Extended Data Fig. 4
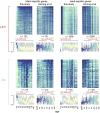
Extended Data Fig. 4. Infant-specific gene expression across ages in two independent datasets.
Heat maps (top) plotting infant-specific gene expression ordered by age in this study and Herring et al. showing higher expression in infant and gestational cases and lower expression in adults for L2/3 neurons and astrocytes. Box plots (bottom) showing mean expression of infant-specific genes and adult-specific genes in L2/3 neurons and astrocytes across ages in this study and Herring et al. Expression of infant-specific genes is significantly higher in donors 28 days to 301 days, the subset that most closely matches the ages of the two infants in this study, compared to donors ≥15. Expression of adult-specific genes is significantly lower in the same group of infant donors compared to donors ≥15. All box plots depict median, and first and third quartile. Whiskers show 1.5 × IQR beyond the first and third quartiles. (Two-sided Wilcoxon rank-sum test).
Extended Data Fig. 5
Extended Data Fig. 5. Validation of downregulation during ageing.
(a) Expression of genes downregulated in the primary analysis (elderly vs. adult) are also downregulated when data is broken down into three groups, donors 15–39 (red, N = 5), donors 40–69 (magenta, N = 6), and donors 70–104 (purple, N = 6). Some cell types exhibit continuous downregulation, showing significant decreases with each age group while others are significantly downregulated between the 15–39- and 40–69-year-old groups but expression does not change between the older adult and elderly groups (Two-sided Wilcoxon rank-sum test). (b) Volcano plots showing the results of expression changes during ageing, determined by linear regression. Regression slope is shown on the x axis and -log10(p-value) on the y axis. Dotted lines indicate slope and p-value thresholds, slope < −0.001 or > 0.001 and p < 0.05, used to determine significance. In addition, genes had to be expressed in at least 25% of the elderly or adult cells to be considered. Blue dots indicate genes that were also identified as significantly downregulated by pairwise comparison and Two-sided Wilcoxon rank-sum test. Red dots indicate genes that were identified as significantly upregulated by pairwise comparison and Wilcoxon test. Open circles indicate genes that did not meet the pairwise comparison criteria for fold change and grey circles indicate genes that met the fold change criteria but did not have significant p-values in the pairwise comparison. (c) Box plots showing the expression, in log(CPM), of significantly downregulated genes in elderly excitatory neurons identified in this study in our donors (left) with the donors from Ling et al. (right). (d) Box plots comparing expression of downregulated genes identified in this study in adults from this study (red, N = 9), all donors from Mathys et al. (violet, N = 189), elderly donors from this study (lilac, N = 7), donors 70–79 from Mathys et al. (light purple, N = 34), and donors over 80 from Mathys et al. (dark purple, N = 155). Two-sided Wilcoxon rank-sum test comparing adults in this study to each of the Mathys groups are all significant. All box plots depict median, and first and third quartile. Whiskers show 1.5 × IQR beyond the first and third quartiles. (*, p > 0.05; **, p > 0.01; ***, p > 0.001).
Extended Data Fig. 6
Extended Data Fig. 6. Spatial transcriptomic validation of snRNA-seq data.
(a) Representative MERFISH sections, showing the assigned cell type from Seurat clustering. (b) UMAP clustering of MERFISH cells showing all identified cell types. Clusters of unknown cells were removed from downstream analysis. Ext indicates cells that expressed multiple excitatory markers and could not be assigned to a specific layer. X- and Y-axis values in a and b reflect pixel positions. (c) Fold change of elderly and adult MERFISH cells of 9 ribosomal proteins (left) and 10 nuclear-encoded mitochondrial proteins (right) in excitatory and L2/3 neurons (Two-sided Wilcoxon rank-sum test, elderly N = 3, adult N = 3). (d,e) Log2 fold change of elderly vs. adult nuclear-encoded mitochondrial genes by snRNA-seq (Two-sided T-Test, elderly N = 7, adult N = 9) (d) and MERFISH (Two-sided Wilcoxon rank-sum test, elderly N = 3, adult N = 3) (e). Genes shown in both d and e are colour-coded. All box plots depict median, and first and third quartile. Whiskers show 1.5 × IQR beyond the first and third quartiles. Points beyond whiskers are outliers. (*, p < 0.05; **, p < 0.01).
Extended Data Fig. 7
Extended Data Fig. 7. Validation of changes in ribosomal-protein genes and nuclear-encoded mitochondrial genes during ageing.
(a) Expression of ribosomal-protein genes in three age groups, 15–39 (red, N = 5), 40–69 (magenta, N = 6), and 70–104 (purple, N = 6) always decreases significantly after age 39. (*, p < 0.05; **, p < 0.01; ***, p < 0.001; Two-sided Wilcoxon rank-sum test). (b) Box plots showing the regression slope of ribosomal-protein genes (teal, N = 81) and nuclear-encoded electron transport chain genes (purple, N = 82). Ribosomal genes shown are the same as shown in Extended Data Fig. 8 and mitochondrial genes shown are the same as shown in Extended Data Fig. 10. (c) Fold change of ribosomal proteins (top) and nuclear-encoded mitochondrial genes (bottom) in ageing in the Ling et al. data for each cell type. The expression changes match those seen in this study. Ext, excitatory neurons; Inb, inhibitory neurons; Oli, oligodendrocytes; OPC, oligodendrocyte precursor cells; Ast, astrocytes; Micro, microglia; Endo, endothelial. (*, p < 0.05; two-sided T-test, elderly N = 116, adult N = 64). (d) Box plots comparing expression of ribosomal-protein genes in adults from this study (red, N = 9), all donors from Mathyset al. (violet, N = 189), elderly donors from this study (lilac, N = 7), donors 70–79 from Mathys et al. (light purple, N = 35), and donors over 80 from Mathys et al. (dark purple, N = 155). Wilcoxon rank-sum test comparing adults in this study to each of the Mathys groups are all significant. (*, p < 0.05; ***, p < 0.001; Two-sided Wilcoxon rank-sum test). (e) Expression of nuclear-encoded mitochondrial genes of the electro transport chain in three age groups, 15–39 (red, N = 5), 40–69 (magenta, N = 6), and 70–104 (purple, N = 6) always decreases significantly after age 39. (*, p < 0.05; **, p < 0.01; ***, p < 0.001; Two-sided Wilcoxon rank-sum test). (f) Box plots comparing expression of nuclear-encoded mitochondrial genes of the electron transport chain in adults from this study (red, N = 9), all donors from Mathys et al. (violet, N = 189), elderly donors from this study (lilac, N = 7), donors 70–79 from Mathys et al. (light purple, N = 34), and donors over 80 from Mathys et al. (dark purple, N = 155). Wilcoxon rank-sum test comparing adults in this study to each of the Mathys groups are all significant. All box plots depict median, and first and third quartile. Whiskers show 1.5 × IQR beyond the first and third quartiles. (***, p < 0.001; Two-sided Wilcoxon rank-sum test).
Extended Data Fig. 8
Extended Data Fig. 8. Mutation spectrum of sSNVs in human neurons.
(a) Total mutation accumulation per neuron correlates significantly with age at a rate of 15.1 SNVs gained/year (p = 2.2×10⁻¹⁶, Pearson’s correlation). (b) Mutation spectrum of sSNVs called in human neuron scWGS data. Each bar represents a specific mutation in a different trinucleotide context. (c) Cosine similarity of the two signatures, A1 and A2, derived de novo from the total mutation spectrum to each single-base substitution signature in the COSMIC database. Signature A1 is most similar to SBS5. Signature A2 is most similar to SBS30.
Extended Data Fig. 9
Extended Data Fig. 9. Comparison of signature A2 with COSMIC and known developmental signatures.
(a) Heat map showing cosine similarity of Signature A2, the mutation spectrum of the infant cells included in this study, signatures identified in Bizzotto et al., Coorens et al. and Park et al., and COSMIC SBS1, SBS5, and SBS30. (b) COSMIC SBS1, SBS5, and SBS30 contribution to Signature A2, the infant mutation spectrum, and developmental signatures identified in Bizzotto et al., Coorens et al. and Park et al. (c) Mutation plots of the signatures compared in a. Percentage of C>T mutations at CpG sites is higher than the percentage of C>N mutations at CpG sites for all signatures except SBS30. Our mutation calling algorithm, SCAN2, is biased against early developmental somatic mutations, because SCAN2 requires called somatic variants in single cells to show no mutant reads in corresponding bulk tissue from the same donor. In practice, this means that many somatic mutations that occur very early in development, which are widely distributed across the body at a high mosaic fraction, are filtered out by our analysis, whereas late-occurring, lower allele fraction variants are likely to remain. Non-scWGS studies designed to study developmental mosaic mutations do not filter out early variants, probably contributing to differences in the overall patterns of mutations between A2 and clonal mosaics identified in other studies. Thus, Signature A2 may represent a mutational process that is prominent in late stages of development that persists in postnatal life.
Extended Data Fig. 10
Extended Data Fig. 10. Validation of changes in gene length and expression during ageing.
(a,b) Box plots show expression of housekeeping genes in decile 1 (a) and neuron-specific genes in decile 10 (b) in three age groups, 15–39 (red, N = 5), 40–69 (magenta, N = 6), and 70–104 (purple, N = 6). Housekeeping genes always decreases significantly after age 39, while neuron-specific genes show no significant changes. (**, p < 0.01; ***, p < 0.001; Two-sided Wilcoxon rank-sum test). (c,d) Linear regression slope of housekeeping (c) and neuron-specific (d) genes by length decile. (e,f) Comparison of elderly to adult expression of housekeeping (e) and neuron-specific genes (f), as determined in this study, by size decile in Ling et al. (R2 = 0.16, p = 2.29×10−67 and R2 = 0.0009, N.S., respectively, elderly N = 116, adult N = 64). Housekeeping genes demonstrate the same length dependent expression changes seen in this study. Neuron-specific genes show no significant relationship between length and expression change, matching the findings of this study. (g,h) Box plots show expression of housekeeping genes in decile 1 (g) and neuron-specific genes in decile 10 (h) in adults from this study (red, N = 9), all donors from Mathys et al. (violet, N = 189), elderly donors from this study (lilac, N = 7), donors 70–79 from Mathys et al. (light purple, N = 34), and donors over 80 from Mathys et al. (dark purple, N = 155). Two-sided Wilcoxon rank-sum test comparing adults in this study to each of the Mathys groups are all significant in housekeeping genes, but neuron-specific genes show no significant changes. All box plots depict median, and first and third quartile. Whiskers show 1.5 × IQR beyond the first and third quartiles. (***, p < 0.001; Wilcoxon rank-sum test).

Update of

References

    1. Lopez-Otin, C., Blasco, M. A., Partridge, L., Serrano, M. & Kroemer, G. Hallmarks of aging: an expanding universe. Cell186, 243–278 (2023). - PubMed
    1. Ham, S. & Lee, S. V. Advances in transcriptome analysis of human brain aging. Exp. Mol. Med.52, 1787–1797 (2020). - PMC - PubMed
    1. Frenk, S. & Houseley, J. Gene expression hallmarks of cellular ageing. Biogerontology19, 547–566 (2018). - PMC - PubMed
    1. Lu, T. et al. Gene regulation and DNA damage in the ageing human brain. Nature429, 883–891 (2004). - PubMed
    1. Kim, J. et al. Prevalence and mechanisms of somatic deletions in single human neurons during normal aging and in DNA repair disorders. Nat. Commun.13, 5918 (2022). - PMC - PubMed

MeSH terms

LinkOut - more resources