. 2025 Sep;645(8082):1002-1010.
doi: 10.1038/s41586-025-09415-y. Epub 2025 Sep 3.

Commensal yeast promotes Salmonella Typhimurium virulence

Affiliations

Commensal yeast promotes Salmonella Typhimurium virulence

Kanchan Jaswal et al. Nature. 2025 Sep.

Abstract

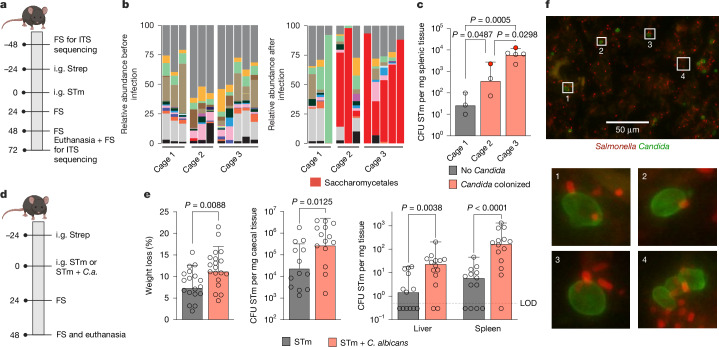
Enteric pathogens engage in complex interactions with the host and the resident microbiota to establish gut colonization1-3. Although mechanistic interactions between enteric pathogens and bacterial commensals have been extensively studied, whether and how commensal fungi affect enteric infections remain largely unknown1. Here we show that colonization with the common human gut commensal fungus Candida albicans worsened infections with the enteric pathogen Salmonella enterica subsp. enterica serovar Typhimurium. The presence of C. albicans in the mouse gut increased Salmonella caecal colonization and systemic dissemination. We investigated the underlying mechanism and found that Salmonella binds to C. albicans via type 1 fimbriae and uses its type 3 secretion system to deliver effector proteins into C. albicans. A specific effector, SopB, was sufficient to manipulate C. albicans metabolism and trigger the release of millimolar amounts of arginine into the extracellular environment. The released arginine, in turn, induced expression of the type 3 secretion system in Salmonella, increasing its invasion of epithelial cells. C. albicans deficient in arginine production was unable to increase Salmonella virulence. Arginine-producing C. albicans also dampened the inflammatory response during Salmonella infection. Arginine supplementation in the absence of C. albicans increased the systemic spread of Salmonella and decreased the inflammatory response, phenocopying the presence of C. albicans. In summary, we identified C. albicans colonization as a susceptibility factor for disseminated Salmonella infection and arginine as a central metabolite in the cross-kingdom interaction between fungi, bacteria and host.


Conflict of interest statement

Competing interests: The authors declare no competing interests.

Figures

Fig. 1
Fig. 1. C. albicans increases Salmonella colonization and dissemination.
a, Schematic representation of the experimental set-up for sequencing analysis. C.a., C. albicans; FS, faecal sample; i.g., intragastrically; strep, streptomycin. b, Relative abundance of fungal genera identified with ITS sequencing in faecal samples of mice before and after STm infection. n = 3 (cages 1 and 2) and n = 5 (cage 3) animals. c, STm colonization in the spleen 72 h post-infection. Mice with reads for C. albicans before infection are represented as red circles. Data are geometric mean ± s.d. n = 3 (cages 1 and 2) and n = 5 (cage 3) animals. Ordinary one-way analysis of variance (ANOVA) for comparison was used. CFU, colony-forming units. d, Schematic representation of the experimental set-up for STm or STm + C. albicans ATCC infection. The schematics in panels a,d were created in BioRender. Behnsen, J. (2025) https://biorender.com/xv05v3d. e, Weight loss and STm colonization in C57BL/6 mice infected with STm or STm + C. albicans ATCC in the streptomycin pre-treatment model at 48 h post-infection. Data are geometric mean ± s.d. (for weight loss and caecum) and median (for liver and spleen). n = 13 (for STm: caecum, liver and spleen), n = 14 (for STm + C. albicans: caecum, liver and spleen), n = 18 (for STm: weight loss) and n = 19 (for STm + C. albicans: weight loss) animals from three independent experiments. Significance was determined by two-tailed Mann–Whitney test (for weight loss and caecal colonization) and mixed-effect analysis with Šídák’s multiple comparisons test (for liver and spleen dissemination). LOD, limit of detection. f, Representative fluorescence image of the lumen of the caecum during mouse infection with STm and C. albicans SC5314. The experiment was repeated independently with six mice. Source data
Fig. 2
Fig. 2. Binding to live Candida increases Salmonella invasion.
a, Invasion assay of STm infected (multiplicity of infection (MOI) = 1) colonic epithelial cells (T84). STm either alone or with C. albicans ATCC in a 10:1 (Salmonella to C. albicans) ratio were incubated for 2 h before the assay. Data are geometric mean ± s.d.; n = 3 independent experiments. Significance was determined using ordinary one-way ANOVA. HK, heat killed. b, Sedimentation assay of STm and C. albicans SC5314. The line at 100% indicates yeast-only sedimentation. Data are geometric mean ± s.d.; n represents independent experiments. Significance was determined using ordinary one-way ANOVA. c, Fluorescence image of STm and C. albicans SC5314 in vitro. d, Invasion assay of STm-infected (MOI = 1) colonic epithelial cells (Caco2). STm either alone or with C. albicans ATCC in a 10:1 ratio were incubated for 2 h before the assay. Data are geometric mean ± s.d.; n = 5 independent experiments. Significance was determined using a two-tailed Mann–Whitney test. e, Volcano plot of differentially regulated STm genes in co-culture with C. albicans ATCC compared with STm alone. SPI-1 genes involved in invasion are in red, and genes involved in arginine transport and downstream metabolism are in blue. FDR, false discovery rate. f, Fluorescence image of STm expressing mCherry and Pprgh-gfp, and C. albicans SC5314 (brightfield) in vitro. g, Arginine levels in cell-free supernatants of STm, C. albicans SC5314 or STm + C. albicans SC5314 cultures incubated for 2 h. Data are median with range; n = 3 independent experiments. Significance was determined using ordinary one-way ANOVA. The dashed line indicates levels in lysogeny broth (LB). h, Invasion assay of STm-infected (MOI = 1) colonic epithelial cells (Caco2). STm either alone or with l-arginine were incubated for 2 h before the assay. Data are geometric mean ± s.d.; n = 3 independent experiments. Significance was determined using ordinary one-way ANOVA. i, rt-qPCR analysis of STm arginine import and metabolism genes from the caecal content of STm or STm + C. albicans ATCC infected mice 48 h post-infection. Data are mean ± s.e.m.; n represents mice of two independent experiments. Significance was determined using two-tailed Welch’s t-test. Bars with no statistics have P > 0.9999. Source data
Fig. 3
Fig. 3. Role of arginine production in C. albicans for Salmonella virulence.
a, rt-qPCR analysis of genes encoding C. albicans arginine biosynthesis from the C. albicans SC5314 or STm + C. albicans SC5314 cultures incubated for 2 h. Data are geometric mean ± s.d.; n = 3 (ARG1) and n = 6 (ARG4) independent experiments. Significance was determined by two-tailed unpaired Student’s t-test for comparison. b, Invasion assay of STm-infected (MOI = 1) colonic epithelial cells (Caco2). STm either alone or with C. albicans SC5314 in a 10:1 (Salmonella to C. albicans) ratio were incubated for 2 h before the assay. Data are geometric mean ± s.d.; n = 3 independent experiments. Significance was determined using ordinary one-way ANOVA for comparison. c, Schematic representation of the experimental set-up for STm or STm + C. albicans infection. Mice were either gavaged again with C. albicans at 24 h post-infection or the day 0 dose of C. albicans was increased to 1 × 107 CFU ml−1. The schematic was created in BioRender. Behnsen, J. (2025) https://biorender.com/xv05v3d. d, STm colonization in C57BL/6 mice infected with STm or STm + C. albicans SC5314 in the streptomycin pre-treatment model for 48 h post-infection. Data are geometric mean ± s.d. (for caecum) and median with range (for spleen) for comparison. n represents animals from four independent experiments. Significance was determined by Kruskal–Wallis test for comparison. Source data
Fig. 4
Fig. 4. Salmonella uses T3SS-1 effector SopB to trigger arginine production in C. albicans.
a, Arginine levels measured in cell-free supernatants of STm and C. albicans SC5314 cultures incubated for 2 h. Data are median with range; n = 3 independent experiments. Significance was determined usng a two-tailed unpaired Student’s t-test for comparison. b,c, rt-qPCR analysis of genes encoding C. albicans arginine biosynthesis from the C. albicans SC5314 or STm + C. albicans SC5314 cultures incubated for 2 h. Data are geometric mean ± s.d. n represents independent experiments. Significance was determined by a Kruskal–Wallis test (b) and an ordinary one-way ANOVA (c) for comparison. d, Arginine levels measured in cell-free supernatants of STm and C. albicans SC5314 cultures incubated for 2 h. Data are represented as median with range; n = 3 independent experiments. Significance was determined by a one-tailed unpaired Student’s t-test for comparison. e, Invasion assay of STm-infected (MOI = 1) colonic epithelial cells (Caco2). STm either alone or with C. albicans SC5314 in a 10:1 (Salmonella to C. albicans) ratio were incubated for 2 h before the assay. Data are geometric mean ± s.d.; n = 3 independent experiments. Significance was determined by two-tailed paired Student’s t-test test for comparison. f, STm colonization in C57BL/6 mice infected with STm or STm + C. albicans SC5314 in the streptomycin pre-treatment model for 48 h post-infection. Data are geometric mean ± s.d. (for caecum) and median with range (for spleen). n represents animals from three independent experiments. Significance was determined using a Kruskal–Wallis test for comparison. g, rt-qPCR analysis of genes encoding C. albicans arginine biosynthesis from C. albicans SC5314 cultures expressing tetO-sopB incubated for 6 h with or without doxycycline (Dox). Data are geometric mean ± s.d.; n = 6 independent experiments. Significance was determined by a two-tailed Mann–Whitney t-test for comparison. Bars with no statistics have P > 0.9999. The dashed line indicates levels in LB (a,d) and LOD (f). Source data
Fig. 5
Fig. 5. Arginine uptake regulates host and Salmonella responses in vivo.
a, Experimental schematic. b, rt-qPCR of host inflammatory genes from the caecal tissue of STm or STm + C. albicans ATCC infected mice 24 h post-infection; n represents animals from three independent experiments. Significance was determined using a two-tailed unpaired Student’s t-test. c, Experimental schematic with 2% l-arginine in drinking water. d, rt-qPCR of host inflammatory genes from the caecal tissue of STm or STm with l-arginine-treated mice 24 h post-infection; n = 6 animals from two independent experiments. Significance was determined using a two-tailed unpaired Student’s t-test. e, STm colonization in C57BL/6 mice infected with STm or STm treated with 2% l-arginine 48 h post-infection. Data are geometric mean ± s.d.; n = 6 animals from two independent experiments. Significance was determined using a Mann–Whitney t-test. f, Experimental schematic. g, rt-qPCR of STm arginine metabolism genes from the caecal content of STm or STm + C. albicans SC5314 infected mice 48 h post-infection; n = 6 animals from two independent experiments. Significance was determined using a two-tailed Mann–Whitney t-test. a.u., arbitrary units. h, STm colonization in C57BL/6 mice infected with STm or STm + C. albicans SC5314 48 h post-infection. Data are geometric mean ± s.d.; n = 6 animals from two independent experiments. Significance was determined using a two-tailed Mann–Whitney t-test. i, Experimental schematic with 20 mM l-lysine in drinking water. The schematics in panels a,c,f,i were created in BioRender. Behnsen, J. (2025) https://biorender.com/xv05v3d. j, STm colonization in C57BL/6 mice infected with STm or STm + C. albicans SC5314 with or without 20 mM l-lysine 48 h post-infection. Data are geometric mean ± s.d.; n represents animals from three independent experiments. Significance was determined using a Kruskal–Wallis test. k, rt-qPCR of host inflammatory genes from the caecal tissue of mice infected with STm or STm + C. albicans SC5314 with or without l-lysine 48 h post-infection; n represents animals from two independent experiments. Significance was determined using a Kruskal–Wallis test. The box and whisker plots show the 25–75th percentile, median, minimum and maximum. All experiments used the streptomycin pre-treatment mouse model. Source data
Extended Data Fig. 1
Extended Data Fig. 1. C. albicans increases Salmonella colonization and dissemination.
a, Relative abundance of C. albicans identified with ITS sequencing in fecal samples of mice before and after STm infection. Mice with reads for C. albicans before infection are represented as red circles. Data are geometric mean ± s.d., n = 3 (Cage 1 and 2) and n = 5 (Cage 3) animals. Two-way ANOVA for comparison. b, STm colonization in liver 72 h p.i. Mice with reads for C. albicans before infection are represented as red circles. Data are median with range, n = 3 (Cage 1 and 2) and n = 5 (Cage 3) animals. Ordinary one-way ANOVA for comparison. c,d, STm colonization in C57BL/6 mice infected with STm or STm and C. albicans ATCC in the streptomycin pre-treatment model for 48 h p.i. Data are median with range. n = 14 (for STm + C. albicans: PP, MLN), n = 13 (for STm: feces, MLN and STm + C. albicans: feces, small intestine) and n = 12 (for STm: PP, small intestine) animals from 3 independent experiments. Two-way ANOVA for comparison. e, C. albicans colonization in C57BL/6 mice infected with C. albicans ATCC or C. albicans ATCC and STm in the streptomycin pre-treatment model for 48 h p.i. Data are median with range. n = 14 (for C. albicans + STm: small intestine, cecum, liver, spleen, PP, MLN), n = 13 (for C. albicans + STm: feces) and n = 3 (for C. albicans only samples) animals from 3 independent experiments. Two-way ANOVA for comparison. f, STm and C. albicans colonization in C57BL/6 mice (male and female) infected with a lower dose (1×10⁷ CFU) STm or (1×10⁷ CFU) STm and (1×10⁷ CFU) C. albicans ATCC in the streptomycin pre-treatment model for 72 h p.i. Data are geometric mean ± s.d. (for feces, small intestine and cecum) and median with range (for liver and spleen). n = 7 (for 72 h STm feces, STm + C. albicans small intestine and C. albicans small intestine) and n = 8 (for all other groups) animals from 2 independent experiments. Two-way ANOVA (feces and small intestine, liver and spleen) and two-tailed Mann–Whitney test (cecum) for comparison. g, Fluorescence image of lumen of colon during mouse infection with STm and C. albicans ATCC. Experiment was repeated independently with 4 mice. h, STm colonization in CBA/J mice infected with STm or STm and C. albicans 529 L in the absence of antibiotics for 9 d p.i. Data are geometric mean ± s.d (for feces) and median with range (for organs and small intestine). Two-way ANOVA for comparison. n = 5 (for STm) and n = 10 (for STm + C. albicans) animals. Bars with no statistics have p > 0.9999. CFU, colony-forming units; STm, Salmonella; PP, Peyer’s patches; MLN, Mesenteric lymph nodes. Source data
Extended Data Fig. 2
Extended Data Fig. 2. Salmonella invasion in the presence of C. albicans.
a, Schematic representation of experimental setup for Invasion assay. b & c, Invasion assay of STm infected (MOI = 1) colonic epithelial cells (Caco2). STm either alone or with C. albicans ATCC(in b) C. albicans SC5314 (in c) in a 10:1 (Salmonella to C. albicans) ratio were incubated for 2 h prior to the assay. Data are geometric mean ± s.d. n = 4 independent experiments. Two-tailed unpaired t-test for comparison. d, Invasion assay of STm infected (MOI = 1) colonic epithelial cells (T84). STm either alone or with C. albicans ATCC in a 10:1(Salmonella to C. albicans) ratio or curdlan (ß-1,3-glucan) 100 μg/ml were incubated for 2 h prior to the assay. Data are geometric mean ± s.d. n = 3 independent experiments. Ordinary one-way ANOVA for comparison. e, Sedimentation assay of STm strains and C. albicans. Data are geometric mean ± s.d. n = 6 (for WT), n = 4 (for Δfim, WT+mannose, ΔinvA, ΔspiB), n = 5 (for ΔinvAΔspiB) and n = 3 (for Δbcf, +C.a. ATCC, and +C.a.529 L) independent experiments. Ordinary one-way ANOVA for comparison. Assays were performed with multiple mutants depicted in Fig. 2b and Extended Data Fig. 2e and one STm WT control in parallel. For easier comparison, STm WT and Δfim values from Fig. 2b were also plotted in this graph. f,g, Fluorescence image of STm (red) and C. albicans SC5314 (green) in vitro present as both yeast and hyphae (in f) and in presence of 5% mannose (in g). h, Invasion assay of STm infected (MOI = 1) colonic epithelial cells (Caco2). STm either alone or with C. albicans ATCC in a 10:1 (Salmonella to C. albicans) ratio with or without mannose were incubated for 2 h prior to the assay. Data are geometric mean ± s.d., n = 4 independent experiments. Two-way ANOVA for comparison. i, Invasion assay of STm infected (MOI = 1) colonic epithelial cells (Caco2). STm either alone or with the supernatant from C. albicans ATCC containing cultures were incubated for 2 h prior to the assay. Data are geometric mean ± s.d. n = 4 (for STm alone) and n = 3 (for other groups) independent experiments. Ordinary one-way ANOVA for comparison. j, Invasion assay of STm infected (MOI = 1) colonic epithelial cells (Caco2). STm either alone or with C. albicans SC5314 in a 10:1 (Salmonella to C. albicans) ratio incubated for 2 h prior to the assay. For direct, both microbes were added to host cells without pre- incubation. Data are geometric mean ± s.d. n = 4 independent experiments. Kruskal-Wallis test for comparison. Bars with no statistics have p > 0.9999. STm, Salmonella. Source data
Extended Data Fig. 3
Extended Data Fig. 3. Salmonella transcriptomic changes in the presence of C. albicans.
a, Enrichment analysis showing upregulated KEGG pathways in STm in the presence of C. albicans ATCC. b, qRT-PCR analysis of STm genes from the STm or STm with either C. albicans ATCC or C. albicans SC5314 cultures incubated for 2 h. Data are geometric mean ± s.d. n = 4 (for SC5314: hilA, invA), n = 3 (for SC5314: arcA and ATCC: hilA, argF, STM4351) and n = 5 (for ATCC: arcA) independent experiments. One sample t-test for comparison. c, qRT-PCR analysis of STm genes from the STm SL1344 or STm SL1344 with C. albicans SC5314 cultures incubated for 2 h. Data are geometric mean ± s.d. n = 3 independent experiments. One sample t-test for comparison. d, Percentage of Pprgh-gfp+ cells in the presence of C. albicans SC5314 after incubation for 2 h. Data are geometric mean ± s.d. of 4 field of view (for STm) and 9 field of view (for STm + C.a.) from 3 independent experiments. Two-tailed Mann-whitney t-test for comparison. e, Genome organization of Arginine deiminase pathway and the corresponding fold increase in RNAseq analysis. f, ß-galactosidase assay performed on STm carrying chromosomal fusion of lacZ with the promoter of hilA after incubation with l-arginine for 2 h. Data are geometric mean ± s.d. n = 4 (without arginine) and n = 3 (with arginine) independent experiments. Ordinary one-way ANOVA for comparison. g, qRT-PCR analysis of STm genes from STm alone or in the presence of l-arginine cultures incubated for 2 h. Data are mean ± SEM. n = 3 independent experiments. Two-way ANOVA for comparison. h, Invasion assay of STm infected (MOI = 1) colonic epithelial cells (T84). STm either alone or with l-arginine were incubated for 2 h prior to the assay. Data are geometric mean ± s.d. n = 3 independent experiments. Two-tailed unpaired t-test for comparison. i, Arginine levels in the cecum content of STm, C. albicans SC5314, or STm and C. albicans SC5314 infected mice 24 h and 48 h p.i. Data are represented as median with range. n = 6 (48 h: STm) and n = 5 (for all other groups) animals. Two-tailed unpaired t-test (24 h) and Ordinary one-way ANOVA (48 h) for comparison. Dashed line indicates levels in uninfected mice. STm, Salmonella. Source data
Extended Data Fig. 4
Extended Data Fig. 4. Role of C. albicans arginine biosynthesis for Salmonella virulence.
a, Schematic of arginine biosynthesis pathway in C. albicans. b, qRT-PCR analysis of genes encoding for C. albicans arginine biosynthesis from C. albicans 529L or STm and C. albicans 529L cultures incubated for 2 h. Data are geometric mean ± s.d. n = 3 independent experiments. Two-tailed unpaired t-test for comparison. c, qRT-PCR analysis of genes encoding for C. albicans arginine biosynthesis from the cecal content of C. albicans SC5314 or STm and C. albicans SC5314 infected mice at 6 and12 h p.i. Data are mean ± SEM. n = 8 (for C. albicans: ARG1 and ARG4) and n = 10 (for STM + C.albicans: ARG1) and n = 7 (for STM + C.albicans: ARG4) animals from 2 independent exp. Two-tailed Welch’s t-test for comparison. d, qRT-PCR analysis of STm genes from the STm or STm with C. albicans SC5314 cultures incubated for 2h. Data are geometric mean ± s.d. n = 3 independent experiments. Two-way ANOVA for comparison. e, Sedimentation assay of STm and C. albicans SC5314. Data are geometric mean ± s.d. n = 5 (for C.a. WT and C.a arg4Δ/Δ) and n = 8 (for C.a. arg4Δ/Δ + ARG4) independent experiments. Ordinary one-way ANOVA for comparison among strains and one sample t-test for comparison with yeast only. f, STm colonization in C57BL/6 mice infected with STm or STm and C. albicans SC5314 in the streptomycin pre-treatment model for 48 h p.i. Data are geometric mean ± s.d. (for feces and small intestine) and median with range (for liver). n = 18 (for STm: 24 h feces, small intestine and liver), n = 13 (for STm+C.a.: 24 h and 48 h feces, small intestine and liver), n = 8 (for STm+C.a. arg4Δ/Δ: 24 h feces), n = 7 (for STm+C.a. arg4Δ/Δ + ARG4: 24 h and 48 h feces, small intestine and liver), n = 17 (for STm: 48 h feces), n = 9 (for STm+C.a. arg4Δ/Δ: 48 h feces, small intestine and liver) from 4 independent experiments. Ordinary one-way ANOVA (for liver) and Mixed-effects analysis (for fecal sample) for comparison. g, C. albicans colonization in C57BL/6 mice infected with C. albicans SC5314 alone or C. albicans SC5314 and STm in the streptomycin pre-treatment model for 48 h p.i. Data are median with range. n = 5 (for C. albicans: 24 h and 48 h feces, small intestine and cecum), n = 13 (for C.a.+STm: 24 h and 48 h feces, small intestine and cecum), n = 8 (for C.a. arg4Δ/Δ+STm: 24 h feces), n = 7 (for C.a. arg4Δ/Δ + ARG4 + STm: 24 h and 48 h feces, small intestine and cecum), and n = 9 (for C.a. arg4Δ/Δ+STm: 48 h feces, small intestine and cecum) of 4 independent experiments. Two-way ANOVA for comparison. h, Arginine levels measured in the cecum content of STm and C. albicans SC5314 infected mice 24 h and 48 h p.i. Data are represented as median with range. n = 5 (for 48 h and STm+ C.a. arg4Δ/Δ+ARG4 24 h) and n = 4 (for STm + C.a. arg4Δ/Δ 24 h) animals. Two-tailed unpaired t-test for comparison. ns = not significant. Bars with no statistics have p > 0.9999. STm, Salmonella; CFU, colony-forming units. Source data
Extended Data Fig. 5
Extended Data Fig. 5. Gut microbiota does not play a major role in enhancing Salmonella virulence in the presence of C. albicans.
a, Schematic representation of experimental setup for STm or STm and C. albicans infection in germ-free mice. b,c,d, STm and C. albicans colonization in C57BL/6 germ-free mice infected with STm or STm and C. albicans SC5314 for 24 h p.i. Data are geometric mean ± s.d. (for feces, small intestine and cecum) and median with range (for liver and spleen). n = 6 (for STm in b,c), n = 7 (for STm + C. albicans in b and 24 h feces and small intestine in d) and n = 8 (for STm + C. albicans in c and 0 h feces and cecum in d) animals from 3 independent experiments. Two-way ANOVA (for b), two-tailed Mann–Whitney test (for c) for comparison. e, Schematic representation of experimental setup for STm or STm and C. albicans infection in ASF mice. f,g,h, STm and C. albicans colonization in C57BL/6 ASF mice infected with STm or STm and C. albicans SC5314 for 48 h p.i. Data are geometric mean ± s.d. (for feces, small intestine and cecum) and median with range (for liver and spleen). n = 5 animal from 2 independent experiments. Two-way ANOVA (for f) and two-tailed Mann–Whitney test (for g) for comparison. i, Arginine levels measured in the cecum content of STm and C. albicans SC5314 infected germ-free and ASF mice 24 h and 48 h p.i., respectively. Data are represented as median with range. n = 5 (for GF: STm and ASF: STm and STm+ C. albicans) and n = 7 (for GF: STm+ C. albicans). Two-tailed Mann-whitney t-test for comparison. Dashed line indicates levels in uninfected mice j, PCoA plots of 16S and ITS sequencing data. DNA was extracted from fecal samples of C57BL/6 mice infected with STm or STm and C. albicans SC5314 and fecal samples were collected at 48 h p.i. k, Relative abundance of bacterial and fungal orders present in samples in j. i.g., intra-gastrically; STm, Salmonella; euth, euthanasia; CFU, colony-forming units; GF, germ-free; ASF, Altered Schaedler flora. Source data
Extended Data Fig. 6
Extended Data Fig. 6. Salmonella uses T3SS-1 effector(s) to trigger arginine production in C. albicans.
a, Invasion assay of STm infected (MOI = 1) colonic epithelial cells (Caco2). STm either alone or with the supernatant from C. albicans ATCC containing cultures were incubated for 2 h prior to the assay. Data are represented as geometric mean ± s.d. n = 4 (for STm WT alone and with coculture supernatant of STm WT + C.a.) and n = 3 (for STm WT with coculture supernatant of STm ΔinvA + C.a.) independent experiments. Ordinary one-way ANOVA for comparison. b & c, qRT-PCR analysis of genes encoding for C. albicans arginine biosynthesis from C. albicans SC5314 or STm and C. albicans SC5314 cultures incubated for 2 h. Data are geometric mean ± s.d. In b, n = 7 (for C. albicans, C. albicans + STm WT), n = 4 (for C. albicans + STm Δfim) and n = 6 (for C. albicans + STm ΔinvA) and in c, n = 3 (for C. albicans + STm ΔsopBE2) and n = 4 (for other groups) independent experiments. Kruskal-Wallis test (for b) and Ordinary one-way ANOVA (for c) for comparison. d, Sedimentation assay of STm and C. albicans SC5314. Data are geometric mean ± s.d. n = 5 independent experiments. Two-tailed unpaired t-test for comparison. e, Invasion assay of STm infected (MOI = 1) colonic epithelial cells (Caco2). STm either alone or with the supernatant from C. albicans SC5314 containing cultures were incubated for 2 h prior to the assay. Data are geometric mean ± s.d. n = 3 independent experiments. Ordinary one-way ANOVA for comparison. f,g, STm and C. albicans colonization in C57BL/6 mice infected with STm or STm and C. albicans SC5314 in the streptomycin pre-treatment model for 48 h p.i. Data are geometric mean ± s.d. In f, n = 8 (for 24 h feces, liver and cecum, and for 48 h STm ΔsopB feces and small intestine) and n = 6 (for 48 h STm ΔsopB + C. albicans feces and small intestine) animals and in g, n = 8 (for cecum), n = 7 (for 24 h feces) and n = 5 (for 48 h feces and small intestine) from 3 independent experiments. Two-way ANOVA (for feces and small intestine) and Kruskal-Wallis test (for liver) are used for comparison. h,i, STm and C. albicans colonization in C57BL/6 mice infected with STm and C. albicans SC5314 in the streptomycin pre-treatment model for 48 h p.i. Data are geometric mean ± s.d. n = 5 (for 24 h and 48 h feces, cecum, liver and spleen), n = 3 (for 48 h small intestine), animals from 3 independent experiments. j, Sedimentation assay of STm SL1344 and C. albicans SC5314. Data are geometric mean ± s.d. n = 3 (for left panel) and n = 6 (for right panel) independent experiments. Ordinary one-way ANOVA for comparison. k,l, qRT-PCR analysis of genes encoding for C. albicans arginine biosynthesis from the C. albicans SC5314 or STm SL1344 and C. albicans SC5314 cultures incubated for 2 h. Data are geometric mean ± s.d. In k, n = 3 (for ARG1 C. albicans + STm) and n = 4 (for other groups) independent experiments and in l, n = 3 (for C. albicans + STm ΔsopB + psopB) and n = 4 (for other groups) independent experiments. Mixed effect analysis (for k) and Two-way ANOVA (for l) for comparison. m, qRT-PCR analysis to confirm sopB expression in C. albicans SC5314 cultures expressing vector control or tetO-sopB. Data are mean ± SEM. n = 2 independent experiments. Two-way ANOVA for comparison. n, qRT-PCR analysis of genes encoding for C. albicans arginine biosynthesis from the C. albicans SC5314 cultures expressing tetO-sopB incubated for 6 h with or without doxycycline. Data are geometric mean ± s.d. n = 6 independent experiments. Two-tailed Mann-Whitney t-test for comparison. o, qRT-PCR analysis of genes encoding for C. albicans arginine biosynthesis from the C. albicans SC5314 cultures expressing vector control incubated for 6 h with or without doxycycline. Data are geometric mean ± s.d. n = 3 independent experiments. Unpaired two-tailed t-test for comparison. Bars with no statistics have p > 0.9999. STm, Salmonella; CFU, colony-forming units; LOD, limit of detection. Source data
Extended Data Fig. 7
Extended Data Fig. 7. Immune response to Salmonella and C. albicans co-infection.
a & b, qRT-PCR analysis of genes encoding for host inflammatory response from the cecum tissue of (for a) STm or STm and C. albicans ATCC infected mice 24 h p.i. and (for b) STm or STm and C. albicans SC5314 infected mice 48 h p.i. In a, n = 16 (STm: Il22), n = 14 (STm: Lcn2, Il1b, Ifnb, Il10, Tnfa, Nos), n = 13 (STm: Ifnl2 and STm + C. albicans: Il22, Lcn2, Il1b, Il10, Tnfa, Nos), n = 12 (STm: Ifnb), n = 10 (Reg3g), n = 9 (STm: Ifng, S1008, S1009, Ptges, Tgfb), n = 8 (STm: Ido1, Il18 and STm + C. albicans: Ifng, S1008, S1009, Ptges, Tgfb), n = 7 (STm + C. albicans: Ifnl2, Il18), n = 6 (STm + C. albicans: Ido1) animals from 3 independent experiments. In b, n = 6 animals from 2 independent experiments. Data are presented as box and whiskers plot from 25th to 75th percentile, median, minimum and maximum. Significance determined by two-tailed unpaired t-test (for a) and Kruskal-Wallis test (for b). c,d,e, STm and C. albicans colonization in C57BL/6 mice infected with STm, C. albicans ATCC, or STm and C. albicans ATCC in the streptomycin pre-treatment model for 24 p.i. Data are geometric mean ± s.d. (for fecal samples and SI content) and Median with range (for organ colonization). In c and d, n = 14 animals and in e, n = 9 (for C. albicans: all groups and C. albicans + STm: small intestine) and n = 14 (for C. albicans + STm: feces, cecum) animals from 3 independent experiments. Two-way ANOVA (for FS), mixed-effects analysis (for d) and Mann Whitney t-test (for cecum in e) for comparison. CFU, colony-forming units; STm, Salmonella; LOD, limit of detection. Source data
Extended Data Fig. 8
Extended Data Fig. 8. Effect of the presence of C. albicans and arginine supplementation during Salmonella infection.
a, qRT-PCR analysis of genes encoding for host arginase genes from the cecum tissue of STm or STm and C. albicans ATCC infected mice 24 h p.i. n = 8 animals from 2 independent experiments. Significance determined by two-tailed Mann–Whitney test. b, ELISA to detect cytokines from the serum of STm or STm and C. albicans SC5314 infected mice. n = 8 (for Tnfa), n = 7 (STm: IL-1b and Stm + C. albicans: IFNg), n = 6 (for IFNg STm) and n = 4 (for IL-1b STm + C. albicans) animals from 2 independent experiments. Data are presented as box and whiskers plot from 25th to 75th percentile, median, minimum and maximum. Significance determined by two-tailed Mann–Whitney test. c, Neutrophils counts for cecum 48 h p.i. from STm or STm and C. albicans ATCC infected mice. Data are geometric mean ± s.d. n = 10 animals. Welch’s t-test for comparison. d, Pathological scores in cecum of STm or STm and C. albicans ATCC infected mice 48 h p.i. Data are mean ± SEM. n = 10 animals. e, qRT-PCR analysis of genes encoding for host inflammatory response from the cecum tissue of STm infected mice with or without l-arginine supplementation 24 h p.i. n = 3 (for Il1b) and n = 6 (for other genes) animals from 2 independent experiments. Data are presented as box and whiskers plot from 25th to 75th percentile, median, minimum and maximum. Significance determined by two-tailed Mann–Whitney test. f,g, STm colonization and Weight loss in STm or STm with l-arginine treated C57BL/6 mice in the streptomycin pre-treatment model for 24 h and 48 h p.i. Data are mean ± s.d. (for weight loss) and geometric mean ± s.d. (for fecal samples, SI content and cecum). n = 6 animals from 2 independent experiments. Mixed-effects analysis (for weight loss, fecal samples and SI content) and two-tailed Mann–Whitney test (for cecum) for comparison. h, Arginine levels measured in the cecum content of STm or STm with l-arginine treated mice 48 h p.i. Data are median with 95% CI. n = 6 (for uninfected), n = 5 (for STm+ arginine) and n = 3 (for STm) animals. Kruskal-Wallis test for comparison. Bars with no statistics have p > 0.9999. STm, Salmonella; FOV, field of view, CFU, colony-forming units. Source data
Extended Data Fig. 9
Extended Data Fig. 9. Arginine transport by Salmonella and host is required for C. albicans to affect Salmonella virulence.
a, Growth curve of STm WT and ΔSTM4351 strains in LB broth. Both curves overlapped. b, Sedimentation assay of STm strains and C. albicans SC5314. Data are geometric mean ± s.d. n = 5 independent experiments. Two-tailed unpaired t-test for comparison. c, qRT-PCR analysis of STm genes from the STm strains either alone or with C. albicans SC5314 cultures incubated for 2 h. Data are geometric mean ± s.d. n = 3 (for STm ΔSTm4351 arcA and STm ΔSTM4351 hilA) and n = 4 (for other groups). Ordinary one-way ANOVA for comparison. d, STm and C. albicans colonization in C57BL/6 mice infected with STm or STm and C. albicans SC5314 in the streptomycin pre-treatment model for 48 h p.i. Data are geometric mean ± s.d. n = 6 animals from 2 independent experiments. Two tailed Mann-Whitney t-test (for liver) and Two-way ANOVA (for fecal sample) for comparison. e, qRT-PCR analysis of genes encoding for host inflammatory response from the cecum tissue of STm or STm and C. albicans SC5314 infected mice 48 h p.i. n = 5 (for ΔSTm4351: Il17), n = 4 (for ΔSTm4351 + C. albicans: Il17) and n = 6 (for other groups) animals from 2 independent experiments. Data are presented as box and whiskers plot from 25th to 75th percentile, median, minimum and maximum. Significance determined by two-tailed Mann-Whitney t-test. f, STm colonization in C57BL/6 mice infected with STm and treated with 20mM l-lysine for 48 h p.i. Data are geometric mean ± s.d. n = 6 (for 24 h feces), n = 9 (for small intestine) and n = 10 (for 48 h feces, cecum, liver and spleen) animals from 3 independent experiments. g, qRT-PCR analysis of genes encoding for host inflammatory response from the cecum tissue of STm infected mice treated with 20mM l-lysine for 48 h p.i. n = 6 animals from 2 independent experiments. Data are presented as box and whiskers plot from 25th to 75th percentile, median, minimum and maximum. h, STm and C. albicans colonization in C57BL/6 mice infected with STm or STm and C. albicans SC5314 in the streptomycin pre-treatment model in the presence and absence of 20mM l-lysine for 48 h p.i. Data are geometric mean ± s.d. n = 6 (for 24 h feces), n = 9 (for 48 h feces: STm, STm + C. albicans; small intestine: STm; liver: STm, STm + C. albicans; spleen: STm, STm + C. albicans; cecum: STm + C. albicans), n = 8 (for small intestine: STm + C. albicans), n = 10 (for small intestine: STm + C. albicans + l-lysine), and n = 11 (for 48 h feces: STm + C. albicans + l-lysine; liver: STm + C. albicans + l-lysine; spleen: STm + C. albicans + l-lysine; cecum: STm + C. albicans + l-lysine) animals from 3 independent experiments. Two-way ANOVA (for feces and cecum), Kruskal-Wallis test (liver and spleen) for comparison. i, qRT-PCR analysis of genes encoding for host inflammatory response from the cecum tissue of mice infected with STm or STm and C. albicans SC5314 with or without l-lysine for 48 h p.i. n = 4 (for STm Il10) and n = 6 (for other groups) animals from 2 independent experiments. Data are presented as box and whiskers plot from 25th to 75th percentile, median, minimum and maximum. Significance determined by Kruskal-Wallis test. Bars with no statistics have p > 0.9999. STm, Salmonella; CFU, colony-forming units; LOD, limit of detection. Source data
Extended Data Fig. 10
Extended Data Fig. 10. Proposed model of interactions between Salmonella, C. albicans, and the host during infection.
Salmonella binds to C. albicans via Type 1 fimbriae (T1F) and uses its Type 3 Secretion System (T3SS)-1 to deliver effector molecules, including SopB, into C. albicans. The effector SopB increases arginine biosynthesis in C. albicans, which is exported into the extracellular environment. Salmonella senses the released arginine and increases virulence gene expression, which results in increased invasion of epithelial cells. Arginine also decreases the inflammatory response to the infection, further facilitating Salmonella pathogenicity and dissemination to peripheral organs.

Update of

References

    1. Jaswal, K., Todd, O. A. & Behnsen, J. Neglected gut microbiome: interactions of the non-bacterial gut microbiota with enteric pathogens. Gut Microbes15, 2226916 (2023). - PMC - PubMed
    1. Olsan, E. E. et al. Colonization resistance: the deconvolution of a complex trait. J. Biol. Chem.292, 8577–8581 (2017). - PMC - PubMed
    1. Rogers, A. W. L., Tsolis, R. M. & Bäumler, A. J. Salmonella versus the microbiome. Microbiol. Mol. Biol. Rev.10.1128/mmbr.00027-19 (2021). - PMC - PubMed
    1. Ng, K. M. et al. Microbiota-liberated host sugars facilitate post-antibiotic expansion of enteric pathogens. Nature502, 96–99 (2013). - PMC - PubMed
    1. Zheng, D., Liwinski, T. & Elinav, E. Interaction between microbiota and immunity in health and disease. Cell Res.30, 492–506 (2020). - PMC - PubMed

MeSH terms

LinkOut - more resources