. 2025 Oct;646(8085):697-706.
doi: 10.1038/s41586-025-09420-1. Epub 2025 Sep 3.

Amygdala-liver signalling orchestrates glycaemic responses to stress

Affiliations

Amygdala-liver signalling orchestrates glycaemic responses to stress

J R E Carty et al. Nature. 2025 Oct.

Abstract

Behavioural adaptations to environmental threats are crucial for survival1,2 and necessitate rapid deployment of energy reserves3-5. The amygdala coordinates behavioural adaptations to threats6, but little is known about its involvement in underpinning metabolic adaptations. Here we show that acute stress activates medial amygdala (MeA) neurons that innervate the ventromedial hypothalamus (MeAVMH neurons), which precipitates hyperglycaemia and hypophagia. The glycaemic actions of MeAVMH neurons occur independently of adrenal or pancreatic glucoregulatory hormones. Using whole-body virus tracing, we identify a polysynaptic connection from MeA to the liver that promotes the rapid synthesis of glucose by hepatic gluconeogenesis. Repeated stress exposure disrupts MeA control of blood glucose, resulting in diabetes-like dysregulation of glucose homeostasis. Our findings reveal an amygdala-liver axis that regulates rapid glycaemic adaptations to stress and links recurrent stress to metabolic dysfunction.


Conflict of interest statement

Competing interests: S.A.S. is a named inventor of patents granted by the United States Patent and Trademark Office: ‘Compositions and Methods to Modulate Cell Activity’ (US 9,399,063 and US 10,064,941) and ‘Ferritin nanoparticle compositions and methods to modulate cell activity’ (US 10,786,570). P.J.K. is a co-founder of Eolas Therapeutics, which is developing novel treatments for substance use disorders. P.J.K. is a consultant for EpiVario.

Figures

Fig. 1
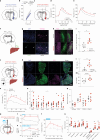
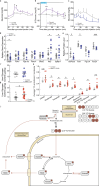
Fig. 1. Stress activation of MeA neurons to regulate glucose.
a, Schematic of the restraint stress condition. Created with BioRender (https://biorender.com/1ikn9ci). b, Blood glucose before and after no stress (control) or a 30 min restraint stress. c, Plasma corticosterone with (red) and without (grey) 30 min of restraint stress. d, Relative fold change in liver G6pc and Pck1 gene expression with (red) and without (grey) exposure to a 30 min restraint stress in sated mice. e, FOS expression in MeA at −1.58 mm from bregma in control and 30 min restrained mice. MeApd, posterior dorsal MeA; MeApv, posterior ventral MeA. Scale bar, 200 μm. f, Number of FOS+ cells in anterior (−1.06 mm to −1.34 mm from bregma) and posterior (−1.34 to −2.06 mm from bregma) MeA with (red) and without (grey) 30 min of restraint stress. g, Schematic of fibre photometry experiment (top) and image of GCaMP8s expression and fibre placement (bottom). Scale bar, 200 μm. ot, optic tract. h, z-score of GCaMP8s signal (bottom) and blood glucose (top) before, during and after 30 min of restraint stress in MeA. Bars along the top indicate capture (pink), restraint (red) and release (grey). i, GCaMP8s z-score aligned to start of the capture period. j, Mean GCaMP8s z-score for 5 min baseline, 30 s capture, 30 min restraint and 5 min release periods. k, Schematic of MeA chemogenetic activation and MeA expression of hSyn-hM3DGq-mCherry. l,m, Blood glucose in mice treated as depicted in k, with CNO (3 mg kg−1, intraperitoneal injection) and fasted for 6 h, without (l) and with (m) metyrapone pretreatment at −60 min relative to CNO injection. n,o, Plasma corticosterone (n) and insulin (o) in mice treated as depicted in k, with CNO (3 mg kg−1, intraperitoneal injection) and fasted for 6 h. Data are mean ± s.e.m. Individual data points represent individual mice. Sample size and statistical analyses in Supplementary Data Table 1. Source Data
Fig. 2
Fig. 2. Acute restraint stress activates MeA→VMH neurons but not MeA→BNST neurons.
a,b, Quantification (a) and imaging (b) of mCherry-labelled synaptophysin with anterograde tracing from MeA neurons. Scale bars, 100 μm. c, Schematic of dual retrograde tracing with injection of AAVretro-RFP and AAVretro-GFP into BNST and VMH, respectively. d, RFP (BNST-projecting neurons) and GFP (VMH-projecting neurons) expression in MeA, with colocalization shown in white. Scale bar, 200 μm. e, Quantification of BNST-projecting and VMH-projecting MeA neurons. f, Number of FOS+ cells in VMH-projecting and BNST-projecting MeA neurons with and without (control) 30 min of restraint stress. g, Colocalization of FOS expression with GFP-labelled VMH-projecting MeA neurons (white arrows). Scale bar, 100 μm. h, Schematic of fibre photometry experiment (right) and axonal GCaMP8s expression and VMH fibre placement (left). 3V, third ventricle. Scale bar, 200 μm. i, GCaMP8s z-score in MeAVMH axons before, during and after 30 min of restraint. Shade bars indicate capture (pink), restraint (red) and release (grey). j, GCaMP8s z-score in MeA→VMH axons aligned to start of the capture period. k, Mean GCaMP8s z-score in MeA→VMH axons for 5 min baseline, 30 s capture, 30 min restraint and 5 min release periods. l, Schematic of fibre photometry (right) and axonal GCaMP8s expression and BNST fibre placement (left). ac, anterior commissure. Scale bar, 200 μm. m, GCaMP8s z-score in MeA→BNST axons before, during and after 30 min of restraint. Bars at the top indicate capture (pink), restraint (red) and release (grey). n, GCaMP8s z-score in MeA→BNST axons aligned to start of the capture period. o, Mean GCaMP8s z-score in MeA→BNST axons for 5 min baseline, 30 s capture, 30 min restraint and 5 min release periods. Data are mean ± s.e.m. Individual data points represent individual mice. Sample size and statistical analysis in Supplementary Data Table 1. Source Data
Fig. 3
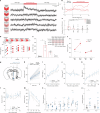
Fig. 3. Gene expression in VMH-projecting MeA neurons.
a, UMAP plot of all MeA cells identified by spatial transcriptomics with clusters and cell types. b, Representative brain slice (top) and MeA region of interest (bottom) with spatial locations of cells profiled by spatial transcriptomics. c, UMAP plot of MeA neurons with neural cluster assignments. d, UMAP plot of GABAergic and glutamatergic (Vglut1+, Vglut2+ and Vglut1/2+) MeA neurons. e, Representative MeA slices showing spatial distribution of glutamatergic and GABAergic MeA neurons, from anterior to posterior MeA. f, Distribution of VMH-projecting mCherry+ MeA neurons shown on the UMAP plot of all MeA neurons. g, Proportion of mCherry+ neurons in Vglut1+, Vglut2+, Vglut1/2+ and GABAergic neural populations. h, Expression of mCherry-labelled synaptophysin in the VMH with anterograde tracing from MeA glutamatergic (top) or GABAergic (bottom) neurons. Scale bar, 200 μm. i, Proportion of mCherry–synaptophysin expressing projections to indicated downstream sites after tracing from glutamatergic (Glut), GABAergic (GABA) and all MeA neurons. j, Blood glucose in CNO-treated mice with MeA expression of CamK2a-hM3DGq (red), Dlx-hM3DGq (blue) or hSyn-mCherry (control, grey). k, Left, heat map of differentially expressed genes (DEGs) in mCherry+ versus mCherry cells for neural clusters with more than ten mCherry+ cells and at least one significant DEG. Top, DEGs in individual clusters. Bottom, DEGs by global comparison on all neurons (with cluster assignment as a covariate). Genes that were significant in both individual clusters and global comparison were omitted from the global section (full lists in Supplementary Data Table 2, S12). z-scores are computed on normalized gene expressions within each individual cluster separately and averaged for mCherry+ and mCherry subsets. Right, heat map of scores from the Human Genetic Evidence framework for glycaemic indices for each DEG. Data are mean ± s.e.m. Individual data points represent individual mice. Sample size and statistical analysis in Supplementary Data Table 1. Source Data
Fig. 4
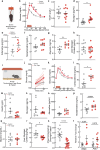
Fig. 4. MeA neurons projecting to VMH regulate blood glucose.
a, Schema for chemogenetic silencing of the MeA–VMH circuit. b, Blood glucose in CNO-injected mice before and after 30 min of restraint stress following MeA–VMH silencing (MeAVMH-Gi) as depicted in a. c, Schema for chemogenetic activation of the MeA–VMH circuit. d,e, Blood glucose during GTT (2 mg kg−1) in CNO-injected mice without (d) and with (e) metyrapone pretreatment (at −60 min) following MeA–VMH activation (MeAVMH-Gq) as depicted in c. f, Schematic for tracing MeA–liver circuits. Created with BioRender (https://BioRender.com/zfc1zkn). g, MeA-connected VMH neurons express Tdtom and liver-connected VMH neurons express GFP. Arrows mark colocalization. h,i, Imaging (h) and quantification (i) of FOS+ neurons among locus coeruleus TH+ neurons in CNO-injected mice treated as depicted in f. j, Schema of sympathetic circuit to liver via coeliac ganglia. Created with BioRender (https://BioRender.com/zfc1zkn). km, Imaging (k) and quantification of FOS+ cells (l) and TH intensity (m) in TH+ coeliac ganglia neurons in CNO-injected mice treated as depicted in j. n, Blood glucose during pyruvate tolerance testing (2 mg kg−1) in CNO-injected mice treated as depicted in j. o, Hepatic gluconeogenic gene expression in CNO-injected mice treated as depicted in j. Glut2 is also known as Slc2a2. p, Hepatic gluconeogenic protein levels in CNO-injected mice treated as depicted in j. q, Schema for optogenetic activation of the MeA–VMH circuit. r,s, Blood glucose changes with 5 min (r) or 15 min (s) optogenetic stimulation in mice transduced in MeA with hSyn-hChR2(H134R) (MeAVMH ChR2) or hSyn-eGFP (control). t, Blood glucose changes during pyruvate tolerance testing (2 mg kg−1) with 15 min optogenetic stimulation in mice transduced in MeA with hSyn-hChR2(H134R) (MeAVMH ChR2, red) or hSyn-eGFP (control, grey). u, Enriched M2 gluconeogenic metabolites during [2,3-13C]pyruvate tolerance testing with 15 min optogenetic stimulation in mice transduced in MeA with hSyn-hChR2(H134R) (MeAVMH ChR2) or hSyn-eGFP (control). Data are mean ± s.e.m. Individual data points represent individual mice. Sample size and statistical analysis in Supplementary Data Table 1. Scale bars, 100 μm. Source Data
Fig. 5
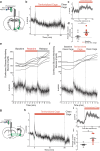
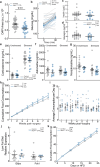
Fig. 5. Blunted MeA→VMH neuron activation with chronic stress promotes weight gain and hyperglycaemia.
a, GCaMP8s z-scores in a MeAVMH axon before, during and after repeated 2 min territorialized cage stress (red bar). b, GCaMP8s z-scores in MeAVMH axons aligned to the start of each territorialized cage exposure. c, Mean axon GCaMP8s z-score for each exposure period. d, Blood glucose before and after each repeated 2 min territorialized cage stress. e, Quantification of MeA FOS+ cells with 1, 8 or 9 exposures to 30 min of restraint stress or unstressed mice, with timeline of the chronic stress regime. f, Blood glucose before and after the first and last 30 min restraint sessions in the chronic stress regime. g, Schema for chronic silencing of the MeA–VMH circuit. h, Blood glucose in mice treated as depicted in g with 30 min of restraint stress. i,j, Body weight (i) and fed blood glucose (j) in mice treated as depicted in g on low fat (chow) diet (LFD). km, Body weight (k), fed blood glucose (l) and blood glucose during GTT (m) in mice treated as depicted in g on high-fat diet (HFD). n,o, Relative expression of adrenergic receptor (n) and gluconeogenic (o) genes in mice treated as depicted in g, on a high-fat diet. Data are mean ± s.e.m. Individual data points represent individual mice. Sample size and statistical analysis in Supplementary Data Table 1. Source Data
Extended Data Fig. 1
Extended Data Fig. 1. Metabolic effects of acute stressors.
a, Schematic of restraint stress. Created with BioRender (https://biorender.com/1ikn9ci). b, Blood glucose during glucose tolerance testing (2mgkg−1) with (red) and without (grey) 30 min restraint stress in 6 h fasted mice. c-f, Plasma insulin (c), glucagon (d), adrenaline (e), noradrenaline (f), and glycerol (g) with (red) and without (grey) 30 min restraint stress in 6 h fasted mice. h, Liver glycogen content with (red) and without 30 min restraint stress (grey) in 6 h fasted mice. i, Schematic of territorialized cage exposure stress. j, Blood glucose with clean cage (grey) or territorialized cage exposure (red) in 6 h fasted mice. k, Blood glucose during glucose tolerance testing (2mgkg−1) with (red) and without (grey) 30 min territorialized cage exposure in 6 h fasted mice. l-q, Plasma corticosterone (l), insulin (m), glucagon (n), adrenaline (o), noradrenaline (p), and glycerol (q) with (red) and without (grey) 30 min territorialized cage exposure in 6 h fasted mice. r, Liver glycogen content with (red) and without (grey) 30 min territorialized cage exposure in 6 h fasted mice. s, Mean food intake during exposure to clean cage (grey) or territorialized cage (red) for 30 min. t, Relative fold change in liver glucose-6-phosphatase (G6pc) and phosphoenolpyruvate carboxykinase 1 (Pck1) gene expression with (red) and without (grey) 30 min territorialized cage exposure in sated mice. Values are means ± s.e.m. Individual data points represent individual mice. Sample size and statistical analysis in Supplementary Data Table 1. Source Data
Extended Data Fig. 2
Extended Data Fig. 2. Medial amygdala activation by stressors to increase glucose.
a, Total MeA cFos+ cell number with (red) and without (grey) 30 min restraint stress. b, CFos+ cell number in ventral and dorsal MeA with (red) and without (grey) 30 min restraint stress. c, CFos+ cell number in the medial amygdala (MeA), the basolateral amygdala (BLA), and the central amygdala (CEA) with (red) and without (grey) 30 min restraint stress. d, MeA GCaMP8s Z score (lower) before, during, and after with corresponding blood glucose (upper) during, 30 min territorialized cage exposure. Shade bar indicates territorialized cage (red). e, MeA GCaMP8s Z score aligned to placement in territorialized cage. f, Mean MeA GCaMP8s Z score for 20 s before and after territorialized cage exposure. g–i, Plasma glucagon (g), adrenaline (h), and noradrenaline (i) in CNO-treated, 6 h fasted MeA hSyn-hM3DGq-mCherry (MeA-Gq, purple) and hSyn-mCherry mice (control, grey). j, Time in elevated plus maze open arms (EPM), light arena of light-dark box (LD), or center time in open field test (OFT) in CNO-treated MeA hSyn-hM3DGq-mCherry (purple) and hSyn-mCherry mice (grey). k, Hourly (left axis) and cumulative (right axis) chow intake in CNO-treated, overnight fasted MeA hSyn-hM3DGq-mCherry (MeA-Gq, purple) and hSyn-mCherry mice (control, grey). l-n, Blood glucose (l), plasma insulin (m), and plasma glucagon (n) in CNO-treated, 6 h fasted male and female MeA hSyn-hM3DGq-mCherry (MeA-Gq, purple) and hSyn-mCherry mice (control, grey). o, Schematic of optogenetic activation of MeA neurons. p,q, Change in blood glucose with 5 (p) or 15 min (q) of optogenetic stimulation in 6 h fasted MeA hSyn-hChR2(H134R) (MeA ChR2, purple) or hSyn-eGFP (control, grey) mice. Values are means ± s.e.m. Individual data points represent individual mice. Sample size and statistical analysis in Supplementary Data Table 1. Source Data
Extended Data Fig. 3
Extended Data Fig. 3. Acute territorialized cage stress activates MeA → VMH and MeA → BNST neurons.
a, Schematic of fiber photometry for VMH-projecting MeA neurons. b, MeA-VMH axon-GCaMP8s Z score in clean cage, during 30 min territorialized cage exposure (red bar), and return to a clean cage. c, MeA-VMH axon-GCaMP8s Z score aligned to placement in territorialized cage. d, Mean MeA-VMH axon-GCaMP8s Z score for 20 s before and after territorialized cage exposure. e, MeA-VMH GCaMP8s Z score (lower) with continuous glucose monitoring (upper) for 5 min baseline, 30 s capture (pink bar), 5 min restraint (red bar), and 5 min release (grey bar) periods. f, MeA-VMH GCaMP8s Z score (lower) with continuous glucose monitoring (upper) for 5 min baseline, 5 territorialized cage exposure (red bar), and 5 min baseline clean cage periods. g, Schematic of fiber photometry for BNST-projecting MeA neurons. h, MeA-BNST axon-GCaMP8s Z score in clean cage, during 30 min exposure to territorialized cage (red bar), and return to a clean cage. i, MeA-BNST axon-GCaMP8s Z score aligned to placement in territorialized cage. j, Mean MeA-BNST axon-GCaMP8s Z score for 20 s before and after territorialized cage exposure. Values are means ± s.e.m. Individual data points represent individual mice. Sample size and statistical analysis in Supplementary Data Table 1. Source Data
Extended Data Fig. 4
Extended Data Fig. 4. Spatial distribution of MeA gene expression.
a, UMAP plot of all MeA cells identified by spatial transcriptomics, showing cell cluster assignments. b-f, Expression levels of Slc17a6 (b), Slc17a7 (c), Slc32a1 (d), Gad1 (e) and Gad2 (f) shown on UMAP plots of MeA neurons. g, Schema of MeA sections used for spatial transcriptomic analysis, organized from anterior to posterior, with the MeA shape and associated bregma coordinate. h, Spatial positions of neurons belonging to different neural clusters in a representative MeA region of interest. i-j, Spatial positions (i) and proportion (j) of neurons expressing glutamatergic subtypes (vGlut1, vGlut2, and vGlut1+ vGlut2) and GABAergic neurons from anterior to posterior MeA position. In spatial plot the 24 ROIs were arranged to reflect the anterior-posterior position of each ROI from left (anterior) to right (posterior), while preserving the relative positions of cells within individual ROIs. k-l, Plot of MeA Cherry+ neuron spatial positions (k) from anterior to most posterior MeA position and proportion of neural subtypes among mCherry+ neurons (l). m, Heatmap of gene expression levels of select cluster gene markers in each neural cluster in the MeA. Z scores are computed on normalized gene expressions across all neurons and averaged in each cluster. Values are means ± s.e.m. Individual data points represent individual mice. Sample size and statistical analysis in Supplementary Data Table 1. Source Data
Extended Data Fig. 5
Extended Data Fig. 5. MeA → VMH but not MeA → BNST neurons regulate glucose responses to stress.
a, Schema for MeA-VMH circuit chemogenetic silencing. b-c, Blood glucose in CNO-injected MeA-VMH hSyn-FLEX-hM4DGi-mCherry (MeAVMH-Gi, blue) or hSyn-FLEX-mCherry (grey) mice with 30-minute territorialized cage exposure stress (b) and without stress (c). d-g, Plasma corticosterone (d), insulin (e), glucagon (f), and adrenaline (g) in CNO-injected MeA-VMH hSyn-FLEX-hM4DGi-mCherry (blue) or hSyn-FLEX-mCherry (grey) mice. h, Schema for MeA-VMH circuit chemogenetic activation. i, Blood glucose in CNO-injected MeA-VMH hSyn-FLEX-hM3DGq-mCherry (MeAVMH-Gq, red) or hSyn-FLEX-mCherry (grey) mice without stress. j-m, Plasma corticosterone (j), adrenaline (k), time course of insulin response (l), and time course of glucagon response (m) in CNO-injected MeA-VMH hSyn-FLEX-hM3DGq-mCherry (red) or hSyn-FLEX-mCherry (grey) mice without stress. n, Schema for MeA-BNST circuit chemogenetic activation. o, Blood glucose in CNO-injected MeA-BNST hSyn-FLEX-hM3DGq-mCherry (MeABNST-Gq, black) or hSyn-FLEX-mCherry (grey) mice without stress. p, Blood glucose during glucose tolerance testing (2 mg kg−1) in CNO-injected MeA-BNST hSyn-FLEX-hM3DGq-mCherry (MeABNST-Gq, black) or hSyn-FLEX-mCherry (grey) mice. q-t, Mean plasma corticosterone (q), glucagon (r), insulin (s), and adrenaline (t) in CNO-injected MeA-BNST hSyn-FLEX-hM3DGq-mCherry (MeABNST-Gq, black) or hSyn-FLEX-mCherry (grey) mice without stress. Values are means±s.e.m. Individual data points represent individual mice. Sample size and statistical analysis in Supplementary Data Table 1. Source Data
Extended Data Fig. 6
Extended Data Fig. 6. MeA → VMH regulation of hepatic glucose production.
a, Blood glucose during pyruvate tolerance test (2 mg kg−1) in CNO-injected hSyn-hM3DGq-mCherry (MeA-Gq, purple) and hSyn-mCherry mice (control, grey). b, Blood glucose during pyruvate tolerance test with 15 min of optogenetic stimulation MeA hSyn-hChR2(H134R) (MeA ChR2, purple) or hSyn-eGFP mice (control, grey). c, Blood glucose during pyruvate tolerance test (2 mg kg−1) in CNO-injected, MeA-VMH hSyn-hM4DGi-mCherry (MeAVMH-Gi, blue) and hSyn-mCherry mice (grey) with 30 min restraint stress. d, Hepatic gluconeogenic gene expression in CNO-injected MeA-VMH hSyn-hM4DGi-mCherry (blue) or hSyn-FLEX-mCherry (grey) mice. e, Hepatic gluconeogenic protein levels in CNO-injected MeA-VMH hSyn-FLEX-hM4DGi-mCherry (blue) or hSyn-FLEX-mCherry (grey) mice with 30 min restraint stress. f, Liver glycogen content in CNO-injected MeA-VMH hSyn-FLEX-hM4DGi-mCherry (blue) or hSyn-FLEX-mCherry (grey) mice with 30 min restraint stress. g, Liver glycogen content in unstressed CNO-injected MeA-VMH hSyn-FLEX-hM3DGq-mCherry (red) or hSyn-FLEX-mCherry (grey) mice. h, Average 13C enrichment per gluconeogenic metabolite as measured by 13C metabolic profiling during [2,3- 13C] pyruvate tolerance testing in unstressed mice expressing ChR2 (red, n = 7) in MeA-VMH neurons compared to those expressing eGFP (grey). i, Schematic of the gluconeogenic pathway with enriched 13C gluconeogenic metabolites, adapted from Kennelly et al.. Values are means±s.e.m. Individual data points represent individual mice. Sample size and statistical analysis in Supplementary Data Table 1. Source Data
Extended Data Fig. 7
Extended Data Fig. 7. Repeated stress blunts MeA and MeA → VMH neural activity.
a, MeA GCaMP6m Z score before, during, and after repeated 2 min exposures to territorialized cage stress (red bars). b, MeA GCaMP6m Z score aligned to start of each territorialized cage exposure period. c, Mean MeA GCaMP6m Z score for each exposure period. d, MeA-VMH axon-GCaMP8s Z score before, during, and after repeated 2 min exposures to territorialized cage stress (red bars). e, Blood glucose before and after each 5-minute territorialized cage exposure stress at 0 h, 6 h, 12 h, 24 h. f, MeA-VMH axon-GCaMP8s Z score before, during, and after repeated 5 min territorialized cage exposure stress (red bars) at 0 h, 6 h, 12 h, 24 h. g, MeA-VMH axon-GCaMP8s Z score aligned to start of each territorialized cage exposure period at 0 h, 6 h, 12 h, 24 h. h, Mean MeA-VMH axon-GCaMP8s Z score for each exposure period. Values are means±s.e.m. Individual data points represent individual mice. Sample size and statistical analysis in Supplementary Data Table 1. Source Data
Extended Data Fig. 8
Extended Data Fig. 8. Effects of chronic silencing of MeA → VMH circuit activity.
a, DAPI+ area in MeA-VMH hSyn-FLEX-DTA (MeAVMH-DTA, blue) or hSyn-FLEX-mCherry (control, grey) mice. b, Blood glucose in chow-fed MeA-VMH hSyn-FLEX-DTA (MeAVMH-DTA, blue) or hSyn-FLEX-mCherry (grey) mice with 30-minute territorialized cage exposure stress. c-d, Mean plasma insulin (c) and glucagon (d) in chow-fed MeA-VMH hSyn-FLEX-DTA (MeAVMH-DTA, blue) or hSyn-FLEX-mCherry (grey) mice with 30-minute restraint stress. e-g, Mean plasma corticosterone (e), adrenaline (f), and noradrenaline (g) without (left) or with 30-minute restraint stress (right) in chow-fed MeA-VMH hSyn-FLEX-DTA (MeAVMH-DTA, blue) or hSyn-FLEX-mCherry (grey) mice. h-i, Cumulative (h) and average daily intake (i) in chow-fed MeA-VMH hSyn-FLEX-DTA (MeAVMH-DTA, blue) or hSyn-FLEX-mCherry (grey) mice. j, Hepatic gluconeogenic gene expression in chow-fed MeA-VMH hSyn-FLEX-DTA (MeAVMH-DTA, blue) or hSyn-FLEX-mCherry (grey) mice. k, Cumulative intake in high fat diet-fed MeA-VMH hSyn-FLEX-DTA (MeAVMH-DTA, blue) or hSyn-FLEX-mCherry (grey) mice. Values are means±s.e.m. Individual data points represent individual mice. Sample size and statistical analysis in Supplementary Data Table 1. Source Data

Update of

References

    1. Gruene, T. M., Flick, K., Stefano, A., Shea, S. D. & Shansky, R. M. Sexually divergent expression of active and passive conditioned fear responses in rats. eLife4, e11352 (2015). - PMC - PubMed
    1. Krishnan, V. et al. Molecular adaptations underlying susceptibility and resistance to social defeat in brain reward regions. Cell131, 391–404 (2007). - PubMed
    1. Mészáros, K., Lang, C. H., Bagby, G. J. & Spitzer, J. J. In vivo glucose utilization by individual tissues during nonlethal hypermetabolic sepsis. FASEB J.2, 3083–3086 (1988). - PubMed
    1. Lang, C. H. & Dobrescu, C. Sepsis-induced increases in glucose uptake by macrophage-rich tissues persist during hypoglycemia. Metabolism40, 585–593 (1991). - PubMed
    1. van der Zwaluw, N. L., van de Rest, O., Kessels, R. P. & de Groot, L. C. Short-term effects of glucose and sucrose on cognitive performance and mood in elderly people. J. Clin. Exp. Neuropsychol.36, 517–527 (2014). - PubMed

LinkOut - more resources