. 2025 Sep 4;380(1934):20240473.
doi: 10.1098/rstb.2024.0473. Epub 2025 Sep 4.

Phage susceptibility to a minimal, modular synthetic CRISPR-Cas system in Pseudomonas aeruginosa is nutrient dependent

Affiliations

Phage susceptibility to a minimal, modular synthetic CRISPR-Cas system in Pseudomonas aeruginosa is nutrient dependent

Josie F K Elliott et al. Philos Trans R Soc Lond B Biol Sci. .

Abstract

CRISPR-Cas systems can provide adaptive, heritable immunity to their prokaryotic hosts against invading genetic material such as phages. It is clear that the importance of acquiring CRISPR-Cas immunity to anti-phage defence varies across environments, but it is less clear if and how this varies across different phages. To explore this, we created a synthetic, modular version of the type I-F CRISPR-Cas system of Pseudomonas aeruginosa. We used this synthetic system to test CRISPR-Cas interference against a panel of 13 diverse phages using engineered phage-targeting spacers. We observed complete protection against eight of these phages, both lytic and lysogenic and with a range of infectivity profiles. However, for two phages, CRISPR-Cas interference was only partially protective in high-nutrient conditions, yet completely protective in low-nutrient conditions. This work demonstrates that nutrient conditions modulate the strength of CRISPR-Cas immunity and highlights the importance of environmental conditions when screening defence systems for their efficacy against various phages.This article is part of the discussion meeting issue 'The ecology and evolution of bacterial immune systems'.

Keywords: CRISPR-Cas; bacteria–phage interactions; microbial ecology and evolution.


Conflict of interest statement

We declare we have no competing interests.

Figures

Validation of a synthetic version of the type I-F CRISPR-Cas system of Pseudomonas aeruginosa PA14.
Figure 1.
Validation of a synthetic version of the type I-F CRISPR-Cas system of Pseudomonas aeruginosa PA14. (A) Schematic of the CRISPR-Cas system locus in the genome of P. aeruginosa PA14 (adapted from [24]). This contains two CRISPR arrays, and six cas genes: Cas1f: endonuclease Cas1; Cas23f: helicase also known as Cas3; Cas8f: also known as Csy1; Cas5f: also known as Csy2; Cas7f: also known as Csy3; Cas6f: endoribonuclease also known as Cas6/Csy4 (names updated from the [24] in line with naming conventions in [33]). In the genome, this locus is antisense but has been displayed in the same sense orientation as the synthetic CRISPR-Cas system for ease of comparison. The relative lengths of each gene in the schematic have been drawn proportional to sequence length. (B) Schematic of the synthetic, minimal, modular CRISPR-Cas system which has the CRISPR arrays reduced to one repeat–spacer–repeat from the CRISPR 2 array. The relative positions of the added restriction sites are shown.
Comparison of the infection characteristics of a panel of 13 phages.
Figure 2.
Comparison of the infection characteristics of a panel of 13 phages. Each phage is presented in the same colour across each panel. Assays were performed on wild-type P. aeruginosa strains (apart from PA14P2 phage, which used a csy3::lacZ knock-out strain). (A–C) Black diamonds represent mean values (n = 3) and error bars show the standard error around the mean. Diamonds coloured by phage show individual replicates. (A) Burst size represents the number of new phage particles released per cell during the burst phase of the one-step growth curve when the first mature phages are assembled post infection. The growth cycle for PA14P2 extended beyond the 2 h measurement window of this experiment; thus the average burst size calculated for this phage is likely an underestimation. (B) Adsorption describes the fraction of total phage population taken up by the cells in the medium during the first part of the growth cycle. (C) Eclipse period describes the time taken from initial infection to when the first mature phages start to be assembled. (D) Plot of local virulence across log multiplicity of infection (MOI). Circles represent mean values (n = 3), and error bars show standard error around the mean. Local virulence represents the area under a growth curve at each MOI of phage infection, normalized against the growth curve when no phages are present.
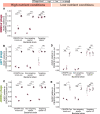
Growth dynamics in response to the various phages with and without a CRISPR-Cas system.
Figure 3.
Growth dynamics in response to the various phages with and without a CRISPR-Cas system. Area under growth curve (AUGC) was normalized relative to the average AUGC for the CRISPR-Cas knock-out strain without phages added and plotted for each strain. The black diamond shows the mean (n = 6 for high-nutrient condition experiments and n = 3 for low-nutrient condition experiments) for each strain, with error bars representing the standard error around the mean. Diamonds for each individual datapoint are coloured by the phage level (displayed left to right: high phage MOI 0.01, low phage MOI 0.0001, no-phage MOI 0). Within each strain, the means at each phage level were compared with t-tests with false discovery rate (FDR) p-correction (*p < 0.05, **p < 0.01, ***p < 0.001, ****p < 0.0001, ns: non-significant). (A) AUGC plot against bacterial strain with high, low or no DMS3vir phage added in high-nutrient conditions. (B) AUGC plot against bacterial strain with high, low or no LBP1 phage added in high-nutrient conditions. (C) AUGC plot against bacterial strain with high, low or no LBP1 phage added in low-nutrient conditions. (D) AUGC plot against bacterial strain with high, low or no JBD63c phage added in high-nutrient conditions. (E) AUGC plot against bacterial strain with high, low or no JBD63c phage added in low-nutrient conditions.

Similar articles

Cited by

  • Preface: the ecology and evolution of bacterial immune systems.
    Westra ER, Gophna U, van Houte S. Westra ER, et al. Philos Trans R Soc Lond B Biol Sci. 2025 Sep 4;380(1934):20240064. doi: 10.1098/rstb.2024.0064. Epub 2025 Sep 4. Philos Trans R Soc Lond B Biol Sci. 2025. PMID: 40904113 Free PMC article. No abstract available.

References

    1. Georjon H, Bernheim A. 2023. The highly diverse antiphage defence systems of bacteria. Nat. Rev. Microbiol. 21, 686–700. ( 10.1038/s41579-023-00934-x) - DOI - PubMed
    1. Gaborieau B, et al. 2024. Prediction of strain level phage–host interactions across the Escherichia genus using only genomic information. Nat. Microbiol. 9, 2847–2861. ( 10.1038/s41564-024-01832-5) - DOI - PubMed
    1. Ceyssens PJ, Lavigne R. 2010. Bacteriophages of Pseudomonas. Future Microbiol. 5, 1041–1055. ( 10.2217/fmb.10.66) - DOI - PubMed
    1. Dion MB, Oechslin F, Moineau S. 2020. Phage diversity, genomics and phylogeny. Nat. Rev. Microbiol. 18, 125–138. ( 10.1038/s41579-019-0311-5) - DOI - PubMed
    1. Brockhurst MA, Koskella B, Zhang QG. 2021. Bacteria-phage antagonistic coevolution and the implications for phage therapy. In Bacteriophages (eds Harper DR, Abedon ST, Burrowes BH, McConville ML), pp. 231–251. Cham, Switzerland: Springer. ( 10.1007/978-3-319-41986-2_7) - DOI

MeSH terms

LinkOut - more resources