Case Reports
. 2025 Aug 19:12:1609941.
doi: 10.3389/fmed.2025.1609941. eCollection 2025.

Metformin may alter the course of Leber's hereditary optic neuropathy: a case report

Affiliations
Case Reports

Metformin may alter the course of Leber's hereditary optic neuropathy: a case report

Shenoda Abd Elmaseh et al. Front Med (Lausanne). .

Abstract

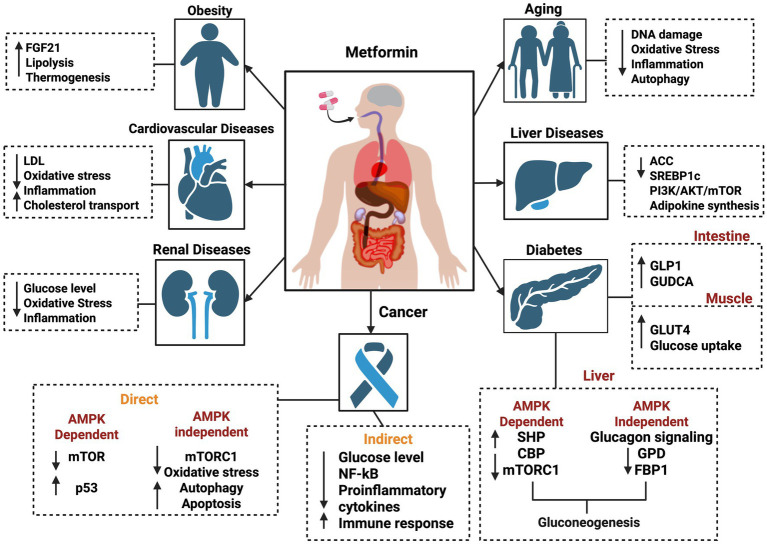
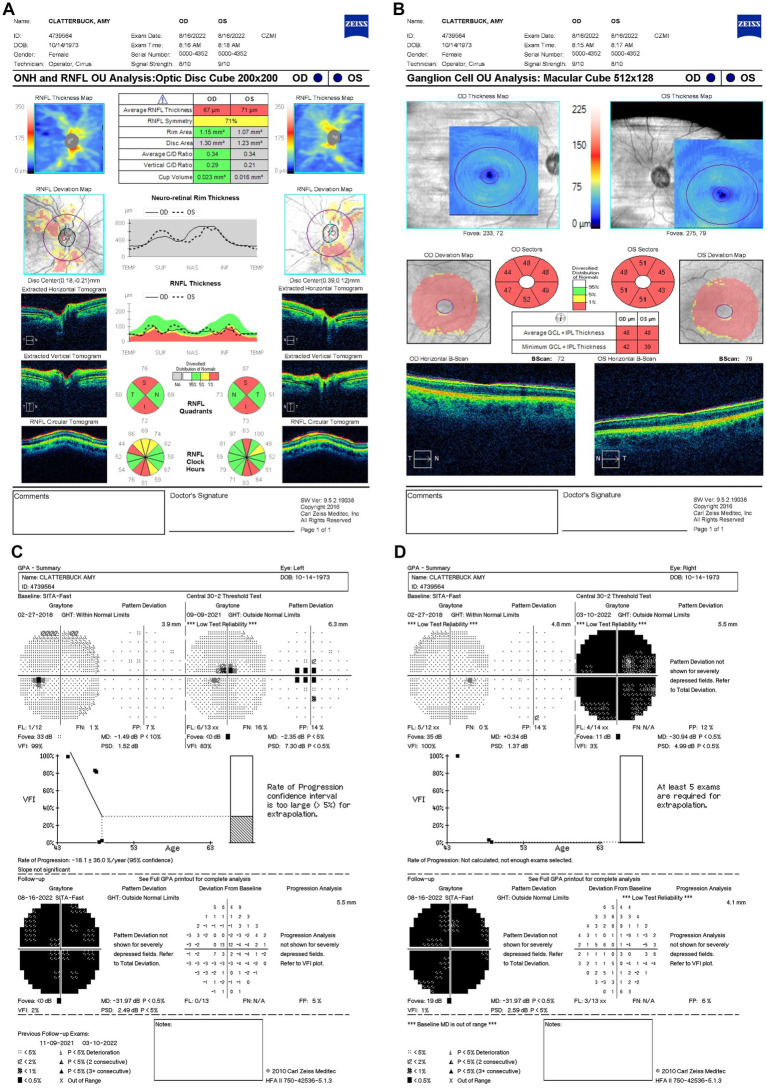
Leber's hereditary optic neuropathy (LHON) is a rare inherited mitochondrial disease caused by variants in mitochondrial DNA (mtDNA) transmitted exclusively through the maternal line. The disease predominantly affects young males and is characterized by progressive bilateral vision loss. Idebenone, a well-studied drug, modestly enhances the mitochondrial function and visual acuity in many patients with LHON. In this study, we report the case of a 48-year-old woman diagnosed with LHON (m.11778G>A/MT-ND4) and type 2 diabetes mellitus who experienced visual field improvement following metformin treatment after 26 months of progressive vision loss unresponsive to idebenone, nicotinamide adenine dinucleotide (NAD+), and hormone replacement therapy (HRT). Our findings offer an intriguing perspective on LHON management but require more investigations, particularly on the molecular effects of metformin on the mitochondrial function in LHON patients.

Keywords: LHON; NAD+; idebenone; metformin; mitochondrial dysfunction; vision Loss.


Conflict of interest statement

The authors declare that the research was conducted in the absence of any commercial or financial relationships that could be construed as a potential conflict of interest. The reviewer VP declared a past co-authorship with the author VC to the handling editor.

Figures

Figure 1
Figure 1
Schematic view of various molecular effects of metformin on different diseases, including obesity, cardiovascular diseases, renal diseases, cancer, diabetes, liver diseases, and aging. The figure was created in BioRender. Source: Sadun A. (2025). Available online at: https://BioRender.com/j88p452.
Figure 2
Figure 2
(A) Zeiss Cirrus OCT of the ONH and RNFL OU analysis: optic disc cube 200 × 200 scan showing a standard bilateral average RNFL thickness on September 9, 2021. (B) Zeiss Cirrus ganglion cell OU analysis: macular cube 512 × 128 scan showing diffuse GCL thinning and swelling on the same date. (C) Zeiss single-field analysis: central 30-2 HVF demonstrating the formation of a central scotoma OU, with standard MD values of −2.35 dB in OS (D) and −0.5 dB in OD on 9 September 2021. OCT, optical coherence tomography; ONH, optic nerve head; RNFL, retinal nerve fiber layer; GCL, ganglion cell layer; HVF, Humphrey visual field; MD, mean deviation; OU, both eyes; OS, left eye; OD, right eye.
Figure 3
Figure 3
(A) Zeiss Cirrus OCT of the ONH and RNFL OU analysis: optic disc cube 200 × 200 scan showing a standard bilateral average RNFL thickness on 9 November 2021. (B) Zeiss Cirrus ganglion cell OU analysis: macular cube 512 × 128 scan showing diffuse GCL thinning and swelling on the same date (C) Zeiss single-field analysis: central 30-2 HVF illustrating the formation of a cecocentral scotoma, with a standard MD of −4.5 dB OS (D) and continued growth of the central scotoma, with a standard MD of −9.24 dB OD on 9 November 2021. OCT, optical coherence tomography; ONH, optic nerve head; RNFL, retinal nerve fiber layer; GCL, ganglion cell layer; HVF, Humphrey visual field; MD, mean deviation; OS, left eye; OD, right eye.
Figure 4
Figure 4
(A) Zeiss Cirrus OCT of the ONH and RNFL OU analysis: optic disc cube 200 × 200 scan showing a standard bilateral average RNFL thickness on 10 March 2022. (B) Zeiss Cirrus ganglion Cell OU analysis: macular cube 512 × 128 scan showing diffuse GCL thinning and swelling on the same date. (C) Zeiss single field analysis: central 30-2 HVF illustrating the formation of a cecocentral scotoma, with a standard MD of −31.89 dB OS (D) and continued growth of the central scotoma, with a standard MD of −30.94 dB OD on 10 March 2022. OCT, optical coherence tomography; ONH, optic nerve head; RNFL, retinal nerve fiber layer; GCL, ganglion cell layer; HVF, Humphrey visual field; MD, mean deviation; OS, left eye; OD, right eye.
Figure 5
Figure 5
(A) Zeiss Cirrus OCT of the ONH and RNFL OU analysis: optic disc cube 200 × 200 scan showing a decreased standard bilateral average RNFL thickness (B) and diffuse GCL thinning and swelling on 16 August 2022. (B) Zeiss Cirrus ganglion cell OU analysis: macular cube 512 × 128 showing diffused GCL thinning and swelling on 16 August 2022. (C,D) Zeiss single-field analysis: central 30-2 HVF demonstrating profound central general depression, with a standard MD of −31.97 dB in both eyes on 16 August 2022. OCT, optical coherence tomography; ONH, optic nerve head; RNFL, retinal nerve fiber layer; OU, both eyes; GCL, ganglion cell layer; HVF, Humphrey visual field; MD, mean deviation.
Figure 6
Figure 6
Timeline of key clinical events, medication interventions, and visual acuity (VA) changes in the affected LHON patient. The timeline illustrates the progression of vision loss, initiation of treatments, and subsequent changes in the VA testing (Snellen chart). The figure was created in BioRender. Source: Sadun A. (2025). Available online at: https://BioRender.com/v2qx9ed.
Figure 7
Figure 7
(A) Zeiss single-field analysis: central 30-2 HVF demonstrating profound central general depression, with a standard MD of −24.46 dB OS (B) and −24.56 dB OD on 11 November 2024. HVF, Humphrey visual field; MD, mean deviation; OS, left eye; OD, right eye.
Figure 8
Figure 8
Zeiss single-field analysis: central 30-2 HVF OS from 27 February 2018 to 11 November 2024. The graph depicts visual field recovery over 2 years from the lowest standard MD of −31.89 to −24.46. HVF, Humphrey visual field; MD, mean deviation; OS, left eye. The figure was created in BioRender. Source: Sadun A. (2025). Available online at: https://BioRender.com/sdyj4x2.
Figure 9
Figure 9
Zeiss single-field analysis: central 30-2 HVF OD from 27 February 2018 to 11 November 2024. The graph depicts visual field recovery over 2 years from the lowest standard MD of −30.94 to −24.66. HVF, Humphrey visual field; MD, mean deviation; OD, right eye. The figure was created in BioRender. Source: Sadun A. (2025). Available online at: https://BioRender.com/b2h0k6y.

Similar articles

References

    1. Newman NJ, Yu-Wai-Man P, Biousse V, Carelli V. Understanding the molecular basis and pathogenesis of hereditary optic neuropathies: towards improved diagnosis and management. Lancet Neurol. (2023) 22:172–88. doi: 10.1016/S1474-4422(22)00174-0, PMID: - DOI - PubMed
    1. Sadun A, Ammar M, Chahal J, Karanjia R. Treatment of Leber’s hereditary optic neuropathy. Curr Pharm Des. (2017) 23:624–8. doi: 10.2174/1381612823666170125164856, PMID: - DOI - PubMed
    1. Poincenot L, Pearson AL, Karanjia R. Demographics of a large international population of patients affected by Leber’s hereditary optic neuropathy. Ophthalmology. (2020) 127:679–88. doi: 10.1016/j.ophtha.2019.11.014, PMID: - DOI - PubMed
    1. Fuller JT, Barnes S, Sadun LA, Ajmera P, Alexandrova AN, Sadun AA. Coenzyme Q10 trapping in mitochondrial complex I underlies Leber’s hereditary optic neuropathy. Proc Natl Acad Sci USA. (2023) 120:e2304884120. doi: 10.1073/pnas.2304884120, PMID: - DOI - PMC - PubMed
    1. Bailey CJ. Metformin: historical overview. Diabetologia. (2017) 60:1566–76. doi: 10.1007/s00125-017-4318-z, PMID: - DOI - PubMed

Publication types

LinkOut - more resources