. 2025 Sep 4;82(1):336.
doi: 10.1007/s00018-025-05834-2.

Lithocholic acid ameliorates ulcerative colitis via the PXR/TLR4/NF-κB/NLRP3 signaling pathway and gut microbiota modulation

Affiliations

Lithocholic acid ameliorates ulcerative colitis via the PXR/TLR4/NF-κB/NLRP3 signaling pathway and gut microbiota modulation

Yaoyao Liu et al. Cell Mol Life Sci. .

Abstract

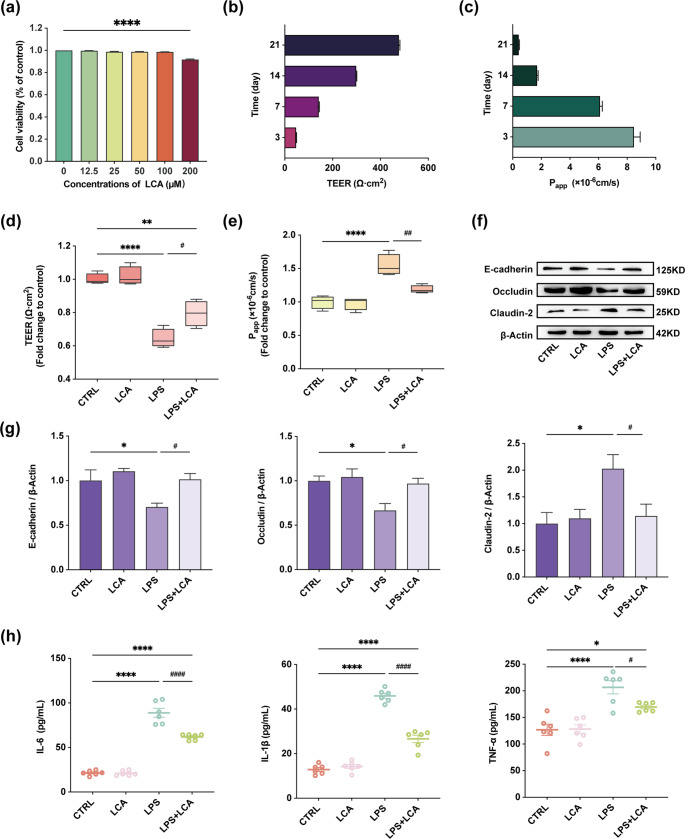
Ulcerative colitis (UC) is a chronic inflammatory condition of the colon, closely linked to dysbiosis of gut microbiota and imbalances in bile acids. Lithocholic acid (LCA), a secondary bile acid, plays a crucial role in maintaining gut health; however, its specific therapeutic potential in UC remains to be fully elucidated. This study investigates the efficacy of LCA in alleviating UC and explores the underlying mechanisms, particularly focusing on the PXR/TLR4/NF-κB/NLRP3 signaling pathway and gut microbiota modulation. Using a dextran sulfate sodium (DSS)-induced colitis model, our findings demonstrate that LCA administration significantly alleviates colitis symptoms, evidenced by reduced disease activity index (DAI), increased colon length, improved intestinal barrier function, and decreased colonic inflammation. Mechanistically, LCA activates the pregnane X receptor (PXR), which inhibits TLR4-mediated NF-κB/NLRP3 inflammasome activation, leading to reduced colonic inflammation and lower levels of pro-inflammatory cytokines. Furthermore, LCA remodels gut microbiota by promoting beneficial bacterial growth, such as Akkermansiaceae, Lactobacillaceae and Muribaculaceae, while suppressing pathogenic and opportunistic pathogens, including Enterobacteriaceae and Bacteroidaceae. The gut microbiota-dependent effects of LCA were corroborated through antibiotic treatment and fecal microbiota transplantation (FMT) experiments. Notably, the absence of intestinal flora affected PXR expression and activity, modifying the aforementioned effects. Overall, our findings reveal that LCA ameliorates experimental colitis by regulating the PXR/TLR4/NF-κB/NLRP3 signaling cascade and modulating gut microbiota composition. This study underscores LCA's potential as a targeted therapeutic strategy and a promising microbiota-focused approach for managing UC, offering new insights into the role of bile acids in intestinal health and disease management.

Keywords: Gut microbiota; Lithocholic acid; NF-κB; NLRP3; Pregnane X receptor; TLR4; Ulcerative colitis.


Conflict of interest statement

Declarations. Competing interests: The authors declare no conflicts of interest. Ethical statement: All animal care and experimental procedures were approved by the Animal Research Committee of Southeast University School of Medicine (Nanjing, China) (No. 20240223001).

Figures

Fig. 1
Fig. 1
LCA improves systemic symptoms, gut barrier integrity, and colonic inflammation in DSS-induced colitis. a VExperimental design. b Daily changes in body weight (n = 12). c DAI scores (n = 12). d Colon images and length measurements (n = 12). e Intestinal permeability assessed by serum FITC-dextran levels (n = 6). f Representative H&E-stained colon tissue sections and histological scores (n = 5). Scale bar = 200 μm. g Representative Alcian blue-stained colon sections and scores (n = 5). Scale bar = 200 μm. h Western blot analysis of tight junction proteins in colonic tissues (n = 9). i Levels of pro-inflammatory cytokines (IL-6, IL-1β, TNF-α) in colonic tissues (n = 7). j Serum ALT and AST levels (n = 6). Data are presented as mean ± SEM. *p < 0.05, **p < 0.01, ***p < 0.001, ****p < 0.0001, versus CTRL group. #p < 0.05, ##p < 0.01, ###p < 0.001, ####p < 0.0001, versus DSS + LCA group
Fig. 2
Fig. 2
LCA enhances barrier function and reduces inflammation in LPS-treated Caco-2 cells. a Cell viability of Caco-2 cells treated with LCA for 24 h, assessed by CCK8 assay. b-c TEER values and Papp of Caco-2 monolayers. d-e TEER values and Papp after treatment. f Western blot analysis of tight junction proteins. g Quantification of tight junction protein expression. h Levels of IL-6, IL-1β, and TNF-α in Caco-2 cell culture supernatants. All experiments were repeated three times. Data are presented as mean ± SEM. *p < 0.05, **p < 0.01, ***p < 0.001, ****p < 0.0001, versus CTRL group. #p < 0.05, ##p < 0.01, ###p < 0.001, ####p < 0.0001, versus DSS + LCA group
Fig. 3
Fig. 3
LCA Attenuates Colitis via PXR Activation and TLR4/NF-κB/NLRP3 Suppression. a mRNA expression of PXR and its target genes in colonic tissues (n = 10). b Western blot analysis of PXR, TLR4, p-IκBα, IκBα, and NLRP3 in colonic tissues (n = 9). c Quantification of protein expression levels (n = 9). d mRNA expression of PXR and its target genes in Caco-2 cells. e Western blot analysis of PXR, TLR4, p-IκBα, IκBα, and NLRP3 in LPS-treated Caco-2 cells. f Quantification of protein expression in Caco-2 cells. All in vitro experiments were repeated three times. Data are presented as mean ± SEM. *p < 0.05, **p < 0.01, ***p < 0.001, ****p < 0.0001, versus CTRL group. #p < 0.05, ##p < 0.01, ###p < 0.001, ####p < 0.0001, versus DSS + LCA group
Fig. 4
Fig. 4
PXR silencing abolishes LCA’s protective effects. a Efficiency of PXR silencing in Caco-2 cells, confirmed by qRT-PCR and Western blot analysis. b Western blot analysis of tight junction proteins in Caco-2 cells with PXR silencing. c Quantification of tight junction protein expression. d Levels of IL-6, IL-1β, and TNF-α in cell supernatants. e Western blot analysis of TLR4, p-IκBα, IκBα, and NLRP3 in Caco-2 cells with PXR knockdown. All experiments were repeated three times. Data are presented as mean ± SEM. *p < 0.05, **p < 0.01, ***p < 0.001, ****p < 0.0001, versus CTRL group
Fig. 5
Fig. 5
Alterations in diversity and composition of gut microbiota after LCA treatment. a Venn diagram showing the shared and unique ASVs among groups (n = 5). b Alpha diversity indices (Chao1 and Observed Species) of gut microbiota. c Beta diversity analysis with Jaccard and unweighted UniFrac distance matrices. d Relative abundance of major bacterial phyla across groups. e-f Stacked bar plots and heatmaps of taxonomic composition at family and genus levels. *p < 0.05, versus CTRL group
Fig. 6
Fig. 6
Identification of characteristic taxa with the greatest difference among groups. a Evolutionary branching diagram of linear discriminant analysis (LDA) effect size (LEfSe) analysis identifying key microbial taxa among groups. b Characteristic taxa using LDA with a threshold score > 3.0
Fig. 7
Fig. 7
LCA alleviates colitis in a gut microbiota-dependent manner. a Experimental design. b Daily changes in body weight (n = 8). c DAI scores (n = 8). d Colon images and length measurements (n = 8). e Intestinal permeability assessed by serum FITC-dextran levels (n = 6). f Representative H&E-stained colon sections and histological scores (n = 4). Scale bar = 200 μm. g Representative Alcian blue-stained colon sections and scores (n = 4). Scale bar = 200 μm. h Western blot analysis and quantification of tight junction proteins (n = 8). i Levels of IL-6, IL-1β, and TNF-α in colonic tissues (n = 8). Data are presented as mean ± SEM. *p < 0.05, **p < 0.01, ***p < 0.001, ****p < 0.0001, versus CTRL group. #p < 0.05, ##p < 0.01, ###p < 0.001, ####p < 0.0001, versus DSS + LCA group
Fig. 8
Fig. 8
Fecal microbiota transplantation restores LCA’s effects. a Experimental design of FMT from CTRL, DSS, and DSS + LCA donors into DSS-treated PGF mice. b Daily changes in body weight (n = 8). c DAI scores (n = 8). d Colon images and length measurements (n = 8). e Intestinal permeability assessed by serum FITC-dextran levels (n = 6). f Representative H&E-stained colon sections and histological scores (n = 4). Scale bar = 200 μm. g Representative Alcian blue-stained colon sections and scores (n = 4). Scale bar = 200 μm. h Western blot analysis and quantification of tight junction proteins (n = 8). (i) Levels of IL-6, IL-1β, and TNF-α in colonic tissues (n = 8). Data are presented as mean ± SEM. *p < 0.05, **p < 0.01, ***p < 0.001, ****p < 0.0001, versus CTRL group. #p < 0.05, ##p < 0.01, ###p < 0.001, ####p < 0.0001, versus DSS + LCA group
Fig. 9
Fig. 9
Gut microbiota influences PXR expression and TLR4/NF-κB/NLRP3 signaling. a Western blot analysis of PXR, TLR4, p-IκBα, IκBα, and NLRP3 in PGF mice. b Western blot analysis of PXR, TLR4, p-IκBα, IκBα, and NLRP3 in FMT-treated mice. c PXR expression of colonic tissues in antibiotic-treated and untreated mice. d Expression of PXR target genes (Abcb1a, Cyp3a11) in antibiotic-treated and untreated mice. Data are presented as mean ± SEM. *p < 0.05, **p < 0.01, ***p < 0.001, ****p < 0.0001, versus CTRL group

Similar articles

References

    1. Le Berre C, Honap S, Peyrin-Biroulet L (2023) Ulcerative colitis. Lancet Lond Engl 402(10401):571–584. 10.1016/S0140-6736(23)00966-2 - PubMed
    1. Herauf M, Coward S, Peña-Sánchez JN et al (2024) Commentary on the epidemiology of inflammatory bowel disease in compounding prevalence nations: toward sustaining healthcare delivery. Gastroenterology 166(6):949–956. 10.1053/j.gastro.2024.02.016 - PubMed
    1. Eisenstein M (2018) Ulcerative colitis: towards remission. Nature 563(7730):S33–S33. 10.1038/d41586-018-07276-2 - PubMed
    1. Dai N, Haidar O, Askari A, Segal JP (2023) Colectomy rates in ulcerative colitis: a systematic review and meta-analysis. Dig Liver Dis 55(1):13–20. 10.1016/j.dld.2022.08.039 - PubMed
    1. Voelker R (2024) What is ulcerative colitis? JAMA 331(8):716. 10.1001/jama.2023.23814 - PubMed

MeSH terms