. 2025 Aug 15;14(8):1059.
doi: 10.3390/biology14081059.

Deciphering the Gene Expression and Alternative Splicing Basis of Muscle Development Through Interpretable Machine Learning Models

Affiliations

Deciphering the Gene Expression and Alternative Splicing Basis of Muscle Development Through Interpretable Machine Learning Models

Xiaodong Tan et al. Biology (Basel). .

Abstract

In chickens, meat yield is a crucial trait in breeding programs. Identifying key molecular markers associated with increased muscle yield is essential for breeding strategies. This study applied transcriptome sequencing and machine learning methods to examine gene expression and alternative splicing (AS) events in muscle tissues of commercial broilers and local chickens. On the basis of differentially expressed genes (DEGs) and differentially spliced transcripts (DSTs) significantly related to breast muscle weight percentage (BrP), high-accuracy prediction models were developed by evaluating 10 machine learning models (e.g., eXtreme Gradient Boosting (XGBoost), Generalized Linear Model Network (Glmnet)). Feature importance was assessed using the Shapley Additive exPlanations (SHAP) method. The results revealed that 50 DEGs and 95 DSTs contributed significantly to BrP prediction. The XGBoost model achieved over 90% accuracy when using DEGs, and the Glmnet model reached 95% accuracy when using DSTs. Through Shapley evaluation, genes and AS events (e.g., ENSGALG00010012060, HINTW, and VIPR2-201) were identified as having the highest contributions to BrP prediction. Additionally, the breed effect was effectively mitigated. This study introduces new candidate genes and AS targets for the molecular breeding of poultry breast muscle traits, offering a paradigm shift from traditional gene mining approaches to artificial intelligence-driven predictive methods.

Keywords: alternative splicing; breast muscle; chicken; machine learning; shapley additive exPlanations.


Conflict of interest statement

The authors declare no conflicts of interest.

Figures
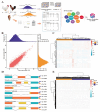
Figure 1
Figure 1
Analytical pipeline and transcriptomic profiling of gene expression and alternative splicing. (A) Workflow involving sampling, sequencing, and machine learning analysis. The different balls indicate 10 machine learning models. XJ, Xianju chickens; CB, commercial broilers; ANN, Artificial Neural Network; DT, Decision Tree; Glmnet, Generalized Linear Model Network; KNN, K-nearest Neighbor; LDA, Linear Discriminant Analysis; LR, Logistic Regression; NB, Naïve Bayes; RF, Random Forest; SKF SVM, Sigmoid Kernel Function Support Vector Machine; XGBoost, eXtreme Gradient Boosting. (B,C) Gene expression profiling of breast muscle tissue in Xianju and commercial broiler chickens. (D,E) Alternative splicing profiling of breast tissue in Xianju and commercial broiler chickens.
Figure 2
Figure 2
Differential expression and splicing analysis in each chicken breed. (A,B) Volcano plot for differentially expressed genes in Xianju and commercial broiler chickens. (C) RT-PCR results for candidate genes in Xianju and commercial broiler chickens. * indicate p < 0.05, ** indicate p < 0.01. (D,E) Volcano plot for differentially spliced genes in Xianju and commercial broiler chickens. (F) Venn plot for differentially spliced and expressed genes and protein-coding genes in Xianju and commercial broiler chickens. DEGs, differentially expressed genes; DSTs, differentially spliced transcripts; PCGs, protein-coding genes.
Figure 3
Figure 3
Accuracy of 10 machine learning models based on differentially expressed genes (AJ) and differentially spliced genes (KT). The dot in each plot indicates the individual accuracy in machine learning modeling. ANN, Artificial Neural Network; DEG, Differentially expressed genes; DST, Differentially spliced transcripts; DT, Decision Tree; Glmnet, Generalized Linear Model Network; KNN, K-nearest Neighbor; LDA, Linear Discriminant Analysis; LR, Logistic Regression; NB, Naïve Bayes; RF, Random Forest; SKF SVM, Sigmoid Kernel Function Support Vector Machine; XGBoost, eXtreme Gradient Boosting. *** indicate p < 0.001.
Figure 4
Figure 4
Evaluation of feature differentially expressed genes (DEGs) and differentially spliced transcripts (DSTs) based on different machine learning models in testing set. (A) Evaluation of feature DEGs based on XGBoost model. The dot indicates the evaluating parameter of each calculation. (B) Receiver operating characteristic (ROC) curve of XGBoost model with feature DEGs. AUC, Area Under the ROC curve. (C) Evaluation of feature DSTs based on Glmnet model. (D) ROC curve of Glmnet model with feature DSTs.
Figure 5
Figure 5
Feature evaluation by SHAP method based on XGBoost and Glmnet models, respectively. (A,B) Beeswarm and bar plots for top 20 feature differentially expressed genes evaluated via SHAP method based on XGBoost model. (C) Dependent plot for ENSGALG00010012060 based on XGBoost model. (D,E) Beeswarm and bar plots for top 20 feature differentially spliced transcripts evaluated via SHAP method based on Glmnet model. (F) Dependent plot for VIPR2-201 based on Glmnet model. SHAP, Shapley Additive exPlanations.
Figure 6
Figure 6
Feature contributions in each chicken breed based on different machine learning models. (A) Contributions of differentially expressed genes in each chicken breed based on XGBoost model. (B) Contributions of feature differentially spliced transcripts in each chicken breed based on Glmnet model.
Figure 7
Figure 7
Enrichment of Gene Ontology based on feature genes (A) and spliced transcripts (B), respectively.

References

    1. FAOSTAT Statistical Database; FA. [(accessed on 30 May 2025)]. Available online: https://www.fao.org/faostat/en/#search/2019.
    1. Poore J., Nemecek T. Reducing food’s environmental impacts through producers and consumers. Science. 2018;360:987–992. doi: 10.1126/science.aaq0216. - DOI - PubMed
    1. Mottet A., Tempio G. Global poultry production: Current state and future outlook and challenges. World’s Poult. Sci. J. 2017;73:245–256. doi: 10.1017/S0043933917000071. - DOI
    1. Zuidhof M.J., Schneider B.L., Carney V.L., Korver D.R., Robinson F.E. Growth, efficiency, and yield of commercial broilers from 1957, 1978, and 2005. Poult. Sci. 2014;93:2970–2982. doi: 10.3382/ps.2014-04291. - DOI - PMC - PubMed
    1. Tan X., Liu R., Zhao D., He Z., Li W., Zheng M., Li Q., Wang Q., Liu D., Feng F., et al. Large-scale genomic and transcriptomic analyses elucidate the genetic basis of high meat yield in chickens. J. Adv. Res. 2024;55:1–16. doi: 10.1016/j.jare.2023.02.016. - DOI - PMC - PubMed

LinkOut - more resources