

doi: 10.3390/biology14081074.
Evaluation of Bacterial Population Changes and Ecological Dynamics in Oil-Impacted Soils Using 16S rRNA Amplicon Sequencing
Affiliations
- PMID: 40906457
- PMCID: PMC12383895
- DOI: 10.3390/biology14081074
Item in Clipboard
Evaluation of Bacterial Population Changes and Ecological Dynamics in Oil-Impacted Soils Using 16S rRNA Amplicon Sequencing
Biology (Basel).
.
Abstract
Soils are vibrant and diverse natural entities situated at the juncture between Earth, air, water, and life [...].
Keywords: 16S rRNA amplicon sequencing; bacterial diversity; metagenomics; soil contamination; soil health; used motor oil.
Conflict of interest statement
The authors declare no conflicts of interest.
Figures
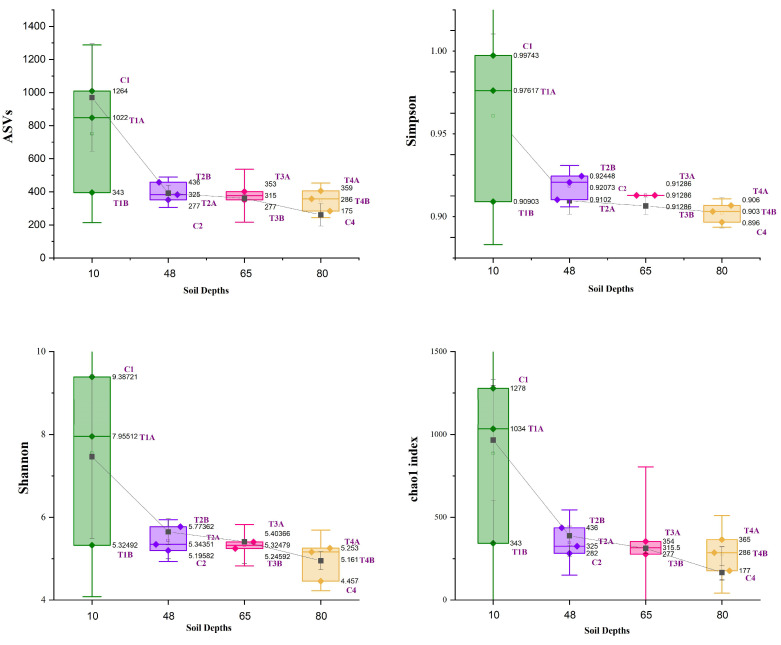
Alpha diversity index of bacterial communities across different soil depths (0–10 cm, 42–48 cm, 61–67 cm, 70–80 cm) and between control (C1, C2, C4) and treatment groups (T1A, T1B, T2A, T2B, T3A, T3B, T4A, T4B).

Clustered stacked column chart showing phylum-level distribution of bacterial composition in control (C1, C2, and C4) and treatment soil (T1, T2, T3, T4).

Clustered stacked column chart showing the class-level distribution of bacterial composition in control (C1, C2, and C4) and treatment soil (T1, T2, T3, T4).

Heat map showing relative abundance of bacterial genera in control (C1–C3) and treatment (T1–T4) soil samples, with color intensity indicating abundance variation.

Trends and abundance of the bacterial genus within the major phyla Firmicutes (F) and Proteobacteria (P) across controls (C1, C2, C4) and treatments (T1, T2, T3, T4). Statistical differences between groups were assessed using the Mann–Whitney U test. Results indicate statistically significant differences (p < 0.05).

Co-occurrence network analysis at the bacterial genus level. The blue and red edges represent positive and negative correlations, respectively.
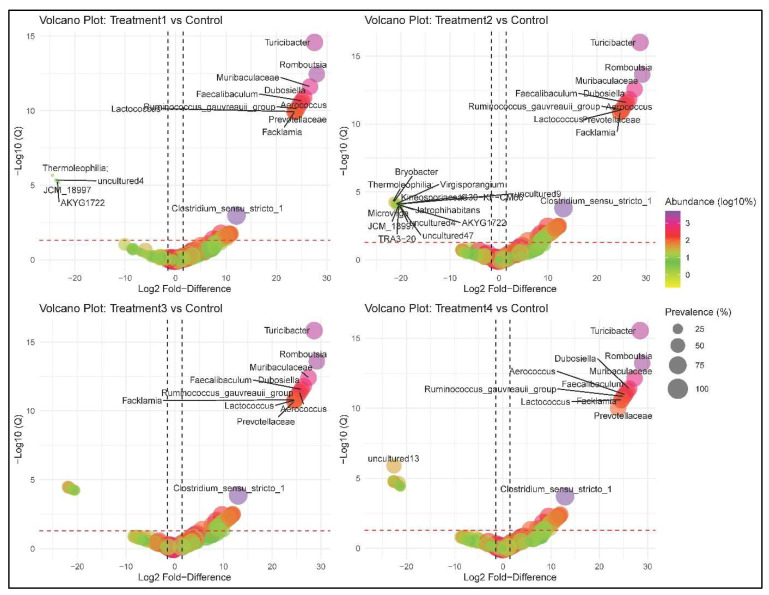
Volcano plots showing bacterial abundance between different treatment groups and control. The x-axis represents the Log2 Fold-Difference, while the y-axis (−Log10(Q)) shows the statistical significance of these differences.
References
-
- Needelman B.A. What are soils? Nat. Educ. Knowl. 2013;4:2.
-
- FAO. UNEP . Global Assessment of Soil Pollution: Report. Food and Agriculture Organization of the United Nations (FAO); Rome, Italy: 2021. - DOI
-
- Akhtar N., Ishak M.I.S., Bhawani S.A., Umar K. Various natural and anthropogenic factors responsible for water quality degradation: A review. Water. 2021;13:2660. doi: 10.3390/w13192660. - DOI
-
- Garbuio F.J., Howard J.L., dos Santos L.M. Impact of human activities on soil contamination. Appl. Environ. Soil Sci. 2012;2012:619548. doi: 10.1155/2012/619548. - DOI
Grants and funding
LinkOut - more resources
Full Text Sources
