. 2025 Sep 4;20(9):e0328903.
doi: 10.1371/journal.pone.0328903. eCollection 2025.

Enhanced electrophysiological recordings in acute brain slices, spheroids, and organoids using 3D high-density multielectrode arrays

Affiliations

Enhanced electrophysiological recordings in acute brain slices, spheroids, and organoids using 3D high-density multielectrode arrays

Lisa Mapelli et al. PLoS One. .

Abstract

Recent advances in three-dimensional (3D) biological brain models in vitro and ex vivo are creating new opportunities to understand the complexity of neural networks but pose the technological challenge of obtaining high-throughput recordings of electrical activity from multiple sites in 3D at high spatiotemporal resolution. This cannot be achieved using planar multi-electrode arrays (MEAs), which contact just one side of the neural structure. Moreover, the specimen adhesion to planar MEAs limits fluid perfusion along with tissue viability and drug application. Here, the efficiency of the tissue-sensor interface provided by advanced 3D high-density (HD)-MEA technology was evaluated in acute brain slices, spheroids, and organoids obtained from different brain regions. The 3D HD-MEA microneedles reached the inner layers of samples without damaging network integrity and the microchannel network between microneedles improved tissue vitality and chemical compound diffusion. In acute cortico-hippocampal and cerebellar slices, signal recording and stimulation efficiency proved higher with the 3D HD-MEA than with a planar MEA improving the characterization of network activity and functional connectivity. The 3D HD-MEA also resolved the challenge of recording from brain spheroids as well as cortical and spinal organoids. Our results show that 3D HD-MEA technology represents a valuable tool to address the complex spatiotemporal organization of activity in brain microcircuits, making it possible to investigate 3D biological models.


Conflict of interest statement

The authors have read the journal’s policy and have the following competing interests: MT, GS, CRB, are paid employees of 3Brain AG. MG, KI, and AM are shareholders of 3Brain AG. The 2D HD-MEA chip and 3D HD-MEA chip are products commercialized by 3Brain AG. This does not alter our adherence to PLOS ONE policies on sharing data and materials.

Figures

Fig 1
Fig 1. 3D HD-MEA chip characterization and tissue penetration.
A, B) SEM images of a 3D HD–MEA with larger (a) or smaller (b) µneedles. Arrows indicate microchannels (µchannel). C) Detailed view on the sensing area of a single µneedle. D) A 250μm thick cerebellar slice fixed on the 3D HD-MEA and used for SEM. A longitudinal cut with a Focused Ion Beam shows the µneedles penetrating the tissue without bending or deforming it. E) Phase-contrast image of a brain spheroid mounted on a 3D HD-MEA showing the intimate contact of the tissue with the µneedles. Notice that the image is focused on the plane of the µneedle tips. F) Digital microscope image (100x magnification) of a cortical brain organoid positioned on the 3D HD-MEA. G, H) Two-photon microscopy volume scans of a brain slice (G) and a brain-spheroid (H) stained with phalloidin (green) and propidium iodide (red), while chip autofluorescence appears in blue. Note the penetration of µneedles into the tissue.
Fig 2
Fig 2. Tissue viability and network preservation in cerebellar slices on planar and 3D HD-MEA.
A) The histogram shows the vitality in the lower surface (in contact with the chip) compared to the upper surface (in contact with the medium) of slices positioned on the planar (2D) or 3D HD–MEA chip for 1h before calcein staining. Representative confocal images at 40x magnification of cerebellar slices loaded with calcein AM in the LMC, IMC, SMC, and 2D are shown below. Living cells are stained in green; cell nuclei are stained in blue (DAPI). Scale bar = 20 µm. Note the higher percentage of living cells on 3D HD–MEA chips. B) The plot shows the percentage of viability of the lower surface compared to the upper surface for each configuration shown in A. The contact area for SMC, IMC, and LMC is estimated from the microchannel width. C) Example of pseudocolor maps obtained with VSDi recordings showing the spatial distribution of granular layer responses to mossy fiber stimulation in CTRL (left) and in a slice on the 3D HD–MEA (right). The stimulating electrode (black) is positioned over the mossy fiber bundle (MF). GL, granular layer. PCL, Purkinje cell layer. ML, Molecular layer. D) The histogram shows the percentage of granular layer area responding to mossy fiber stimulation in VSDi experiments. The area in the two conditions tested is not significantly different (data are reported as mean± MSE. As in the text, LMC, IMC, SMC, stand for 3D HD–MEA chips with large, intermediate, and small microchannels, while CTRL means placing the tissue on a coverslip.
Fig 3
Fig 3. Recording capabilities of 3D HD-MEA compared to planar HD-MEA in cerebellar slices.
A) Images of cerebellar slices overlaid with the corresponding electrical activity maps showing the mean firing rate detected by the HD-MEA electrodes (color scale bar: 0- 10 spikes/s; mean firing rate > 0.5 spikes/s). Left: slice placed on a planar HD-MEA chip; right: slice placed on a 3D HD-MEA chip. The insets show SEM images of the planar and 3D HD-MEA chips. B) The histograms show the number of electrodes recording at least one extracellular unit, the number of recoded cells, and the cells/electrode ratio for the planar and 3D HD-MEA chips. C) The histograms show the mean firing rate and peak-to-peak amplitude of the units recorded by the planar and 3D HD-MEA chips. In B and C, histograms report mean ± MSE and asterisks indicate significant differences at * p < 0.05, ** p < 0.01, and *** p < 0.001.
Fig 4
Fig 4. Recording capabilities of 3D HD-MEA with respect to planar HD-MEA in cortico-hippocampal slices.
A) Images of cortico-hippocampal slices overlayed with the corresponding electrical activity maps showing the number of spikes detected in 3 minutes by the HD-MEA electrodes (color scale bar: 0-50 spikes). Top: slice placed on a planar HD-MEA chip; bottom: slice placed on a 3D HD-MEA chip. B) Distribution of the number of spikes by cell count in the planar and 3D HD-MEA chip. C) The histograms show the average number of active electrodes, average number of active cells, average total number of spikes and the peak-to-peak amplitude of the spikes recorded by the planar and 3D HD-MEA chip. In B and C, histograms report mean ± MSE and asterisks indicate significant differences at * p < 0.05.
Fig 5
Fig 5. Accelerated drug action with 3D HD-MEA compared to planar HD-MEA.
To test the effectiveness of drug perfusion, TTX was applied to acute cerebellar slices. A) Examples of electrical activity maps showing the distribution of active electrodes before (top) and after TTX application (bottom) in a slice placed on a 3D chip (color scale bar: 0-300 µV). B) The plot shows the normalized time course of the mean firing rate (MFR) of the active units following TTX perfusion over the cerebellar slices placed on planar and 3D HD-MEAs. The mean firing rate was normalized to 1 min basal activity recorded before TTX application. C) The histograms show the time needed to reach the 10%, 50%, or 90% decrease in firing frequency after TTX application in both conditions. Histograms report mean ± MSE and asterisks indicate significant differences at * p < 0.05, ** p < 0.01, *** p < 0.001.
Fig 6
Fig 6. Neuronal activity evoked by electrical stimulation in cerebellar slices with 3D HD-MEA chips.
A) Stimulation using bidirectional electrodes in correspondence of the mossy fiber bundle evoked granular layer responses in different lobules. The evoked local field potentials (LFP) were abolished by NBQX and TTX. The electrical stimulation is delivered through the channels indicated by red and green dots in the slice image with the activity map superimposed. Color scale bar: 0-300 µV. The single traces refer to LFPs in control condition, 25 min after NBQX perfusion, and 5 min after TTX perfusion. B) Raster plots and peri-stimulus time histograms (PSTH) of a responsive Purkinje cell located in the stimulated lobule in the control condition (CTRL) and after NBQX perfusion. The corresponding raw traces are reported in C). The Purkinje cell burst-pause response follows the synaptic activation of granule cells, indicating that the stimulus effectively propagates through the network. The pause indicates the involvement of feedforward inhibition in the molecular layer.
Fig 7
Fig 7. Characterization of electrical activity from mouse PrL with the 3D HD-MEA.
A) Examples of a brain slice showing LFPs placed on the 3D HD-MEA chip. From left to right: entire slice indicating the PrL location; zoom of the PrL area showing the connectivity maps in Krebs, mACSF, and during gabazine perfusion. The 3 min raster plots of spontaneous activity for each condition are shown below. B) Examples of raw traces of spontaneous activity recordings for each condition (Krebs, mACSF, and gabazine) from the same slice in A. The dots are spike markers. The spontaneous LFP with spikes is indicated with a bar. C) The plots show the correlation index (CI) in Krebs in the two groups of slices (left), and the CI % change in the three conditions tested in group 1 (middle) and group 2 (right). Data are reported as mean ± MSE. Asterisks indicate significant differences at * p < 0.05, ** p < 0.01, *** p < 0.001.
Fig 8
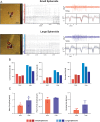
Fig 8. Recording electrical activity from mouse spheroids with 3D HD-MEA.
A version of 3D HD-MEA equipped with thinner µneedles (width 14 µm, height 65 µm; see Methods and main text) was used with spheroids. A) Pictures of small and large spheroids on chips are overlayed with the corresponding electrical activity maps (left) showing the mean firing rate detected by the 3D HD-MEA electrodes (color scale bar: 0-10 spikes/s). The raster plots (middle) show the spiking activity over 2.5 minutes. Representative raw traces and averaged waveforms for three electrodes are shown on the right. B) The histograms show the number of electrodes sampling the spheroids, the number of active electrodes, and the number of active units for small and large spheroids. C) The histograms show the mean firing rate, the spike peak-to-peak amplitude, and the bursting rate in small and large spheroids. Notice that the spheroid size did not affect the peak-to-peak amplitude. Error bars indicate the standard error.
Fig 9
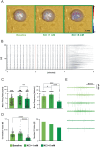
Fig 9. Recording electrical activity from a human cortical organoid with 3D HD-MEA.
A) Pictures of an organoid on chip are overlayed with the corresponding connectivity map (from left to right: baseline, + 1 mM, + 5 mM KCl). Connectivity maps are calculated using cross-correlation analysis (see Methods). Each link is color-coded based on its normalized correlation level. Red and blue dots represent the nodes with incoming and outgoing links respectively, grey dots represent nodes with both links. B) Raster plot indicating the activity pattern over time for each experimental condition. Black dots indicate the detected spikes, red lines indicate the change in [K+] in the medium. C) The histograms show the firing and bursting metrics to determine activity and network synchronicity, respectively. D) The histograms show the strength and number of links, resulting from cross-correlation analysis. Error bars indicate the standard error. E) Representative traces for each recording phase showing the modulation of spiking activity. Asterisks indicate significant differences at * p < 0.05, ** p < 0.01, *** p < 0.001.
Fig 10
Fig 10. Recording of electrical activity from a human spinal organoid with 3D HD-MEA.
A) Spike maps indicating the color-coded mean firing rate for each electrode of the chip in the three conditions tested (from left to right: baseline, + 1 mM, + 5 mM KCl). B) Raster plot indicating the activity pattern over time of each experimental condition. Black dots indicate the detected spikes. Red lines indicate the change in [K+] in the medium; bursts are highlighted in yellow. C) The histograms show the firing and bursting metrics to determine activity and network synchronicity. D) Raising KCl concentration of 1 mM resulted in an increased, although not significant, number of spikes recruited in bursts. Conversely, a higher KCl concentration (+5 mM) caused the number of burst spikes to recover baseline (p < 0.0001, n = 230) and to increase the ISI irregularity within bursts (p < 0.05, n = 230). Error bars indicate the standard error. E) Representative traces for each recording phase showing the modulation of spiking activity. Asterisks indicate significant differences at * p < 0.05, ** p < 0.01, **** p < 0.0001.

References

    1. Gordon A, Yoon S-J, Tran SS, Makinson CD, Park JY, Andersen J, et al. Long-term maturation of human cortical organoids matches key early postnatal transitions. Nat Neurosci. 2021;24(3):331–42. doi: 10.1038/s41593-021-00802-y - DOI - PMC - PubMed
    1. Ballini M, Müller J, Livi P, Chen Y, Frey U, Stettler A, et al. A 1024-Channel CMOS Microelectrode Array With 26,400 Electrodes for Recording and Stimulation of Electrogenic Cells In Vitro. IEEE J Solid-State Circuits. 2014;49(11):2705–19. doi: 10.1109/JSSC.2014.2359219 - DOI - PMC - PubMed
    1. Costamagna G, Comi GP, Corti S. Advancing drug discovery for neurological disorders using iPSC-derived neural organoids. Int J Mol Sci. 2021;22(5):2659. doi: 10.3390/ijms22052659 - DOI - PMC - PubMed
    1. Odawara A, Matsuda N, Ishibashi Y, Yokoi R, Suzuki I. Toxicological evaluation of convulsant and anticonvulsant drugs in human induced pluripotent stem cell-derived cortical neuronal networks using an MEA system. Sci Rep. 2018;8(1):10416. doi: 10.1038/s41598-018-28835-7 - DOI - PMC - PubMed
    1. Tukker AM, Wijnolts FMJ, de Groot A, Westerink RHS. Human iPSC-derived neuronal models for in vitro neurotoxicity assessment. NeuroToxicology. 2018;67:215–25. doi: 10.1016/j.neuro.2018.06.007 - DOI - PubMed

LinkOut - more resources