. 2025 Sep 4;389(6764):eadu4132.
doi: 10.1126/science.adu4132. Epub 2025 Sep 4.

Lewy body dementia promotion by air pollutants

Affiliations

Lewy body dementia promotion by air pollutants

Xiaodi Zhang et al. Science. .

Abstract

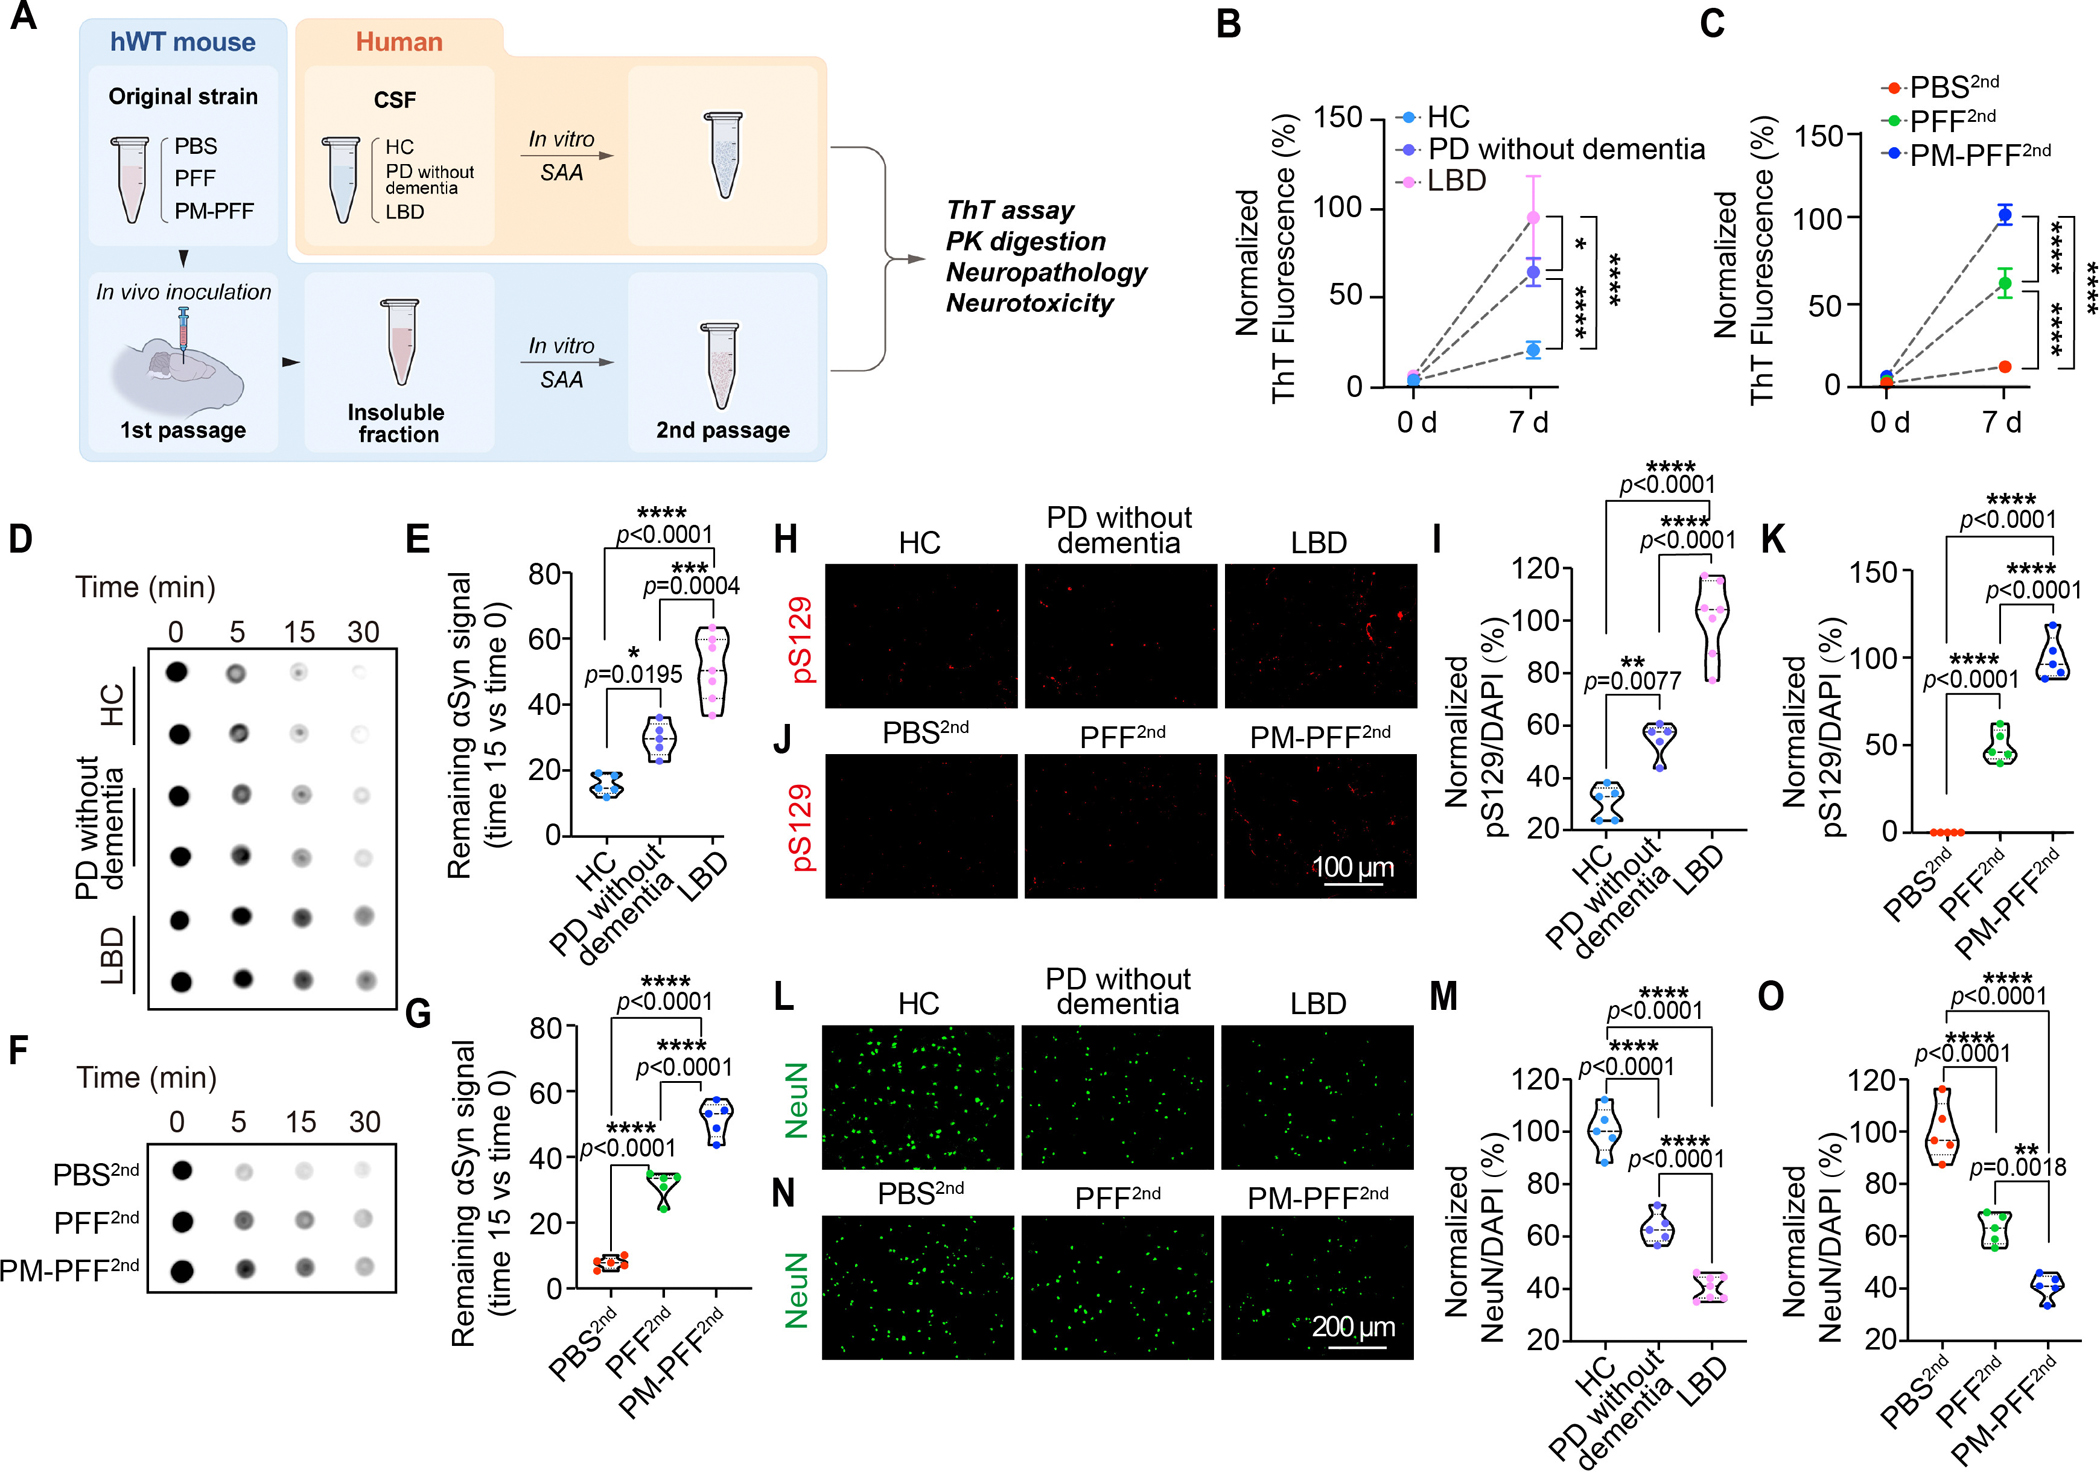
Evidence links air pollution to dementia, yet its role in Lewy body dementia (LBD) remains unclear. In this work, we showed in a cohort of 56.5 million individuals across the United States that fine particulate matter (PM2.5) exposure raises LBD risk. Mechanistically, we found that PM2.5 exposure led to brain atrophy in wild-type mice, an effect not seen in α-synuclein (αSyn)-deficient mice. PM2.5 exposure generated a highly pathogenic αSyn strain, PM2.5-induced preformed fibril (PM-PFF), with enhanced proteinase K resistance and neurotoxicity, resembling αSyn LBD strains. PM2.5 samples from China, the United States, and Europe consistently induced proteinase-resistant αSyn strains and in vivo pathology. Transcriptomic analyses revealed shared responses between PM2.5-exposed mice and LBD patients, underscoring PM2.5's role in LBD and stressing the need for interventions to reduce air pollution and its associated neurological disease burden.


Figures

Fig. 1
Fig. 1. Correlation between PM2.5 exposure with LBD/PD outcomes.
(A) Nationwide PM2.5 concentrations across the contiguous United States from 2000 to 2014. (B) Occurrences of first hospital admissions for four α-synucleinopathies across the contiguous United States from 2000 to 2014, per 100,000 Medicare fee-for-service beneficiaries. (C) Hazard Ratios (HRs) and 95% Confidence Intervals (CIs) for long-term PM2.5 exposure and first hospital admissions for four α-synucleinopathies. HRs were calculated using Cox proportional hazard models, adjusted for socioeconomic factors, behavioral risk factors, meteorological variables, geographic region, and year. (D) HRs and 95% CIs for long-term PM2.5 exposure and first hospital admissions for four α-synucleinopathies across different exposure windows. 10-Year and 5-Year Moving Average refer to time-varying averages over the 10- and 5-year periods preceding the hospital admission. 10-Year and 5-Year Lagged refer to annual PM2.5 concentrations from 10 and 5 years before the hospital admission.
Fig. 2
Fig. 2. αSyn Depletion Prevents PM2.5-Induced Brain Atrophy and Cell Death.
(A) PM2.5 extraction and preparation method. (B) In vivo experiment timeline: nasal PM2.5 administration to WT and αSyn−/− mice. (C) Nissl staining of 12-mon-old mouse brains after 10-mon PM2.5 exposure. (D-F) Volume measurements of (D) posterior lateral ventricle (LV), (E) medial temporal lobe (MTL), and (F) hippocampus (Hip) (n = 6). (G, H) Representative images showing TUNEL (red) and NeuN (green) staining in the cortex of WT and αSyn−/− mice after exposure to either PBS or PM (n = 4). Normalized Statistics: Data are presented as violin plots showing all individual data points. Statistical significance was determined by using one-way ANOVA with Tukey’s correction; **p < 0.01, ***p < 0.001, ****p < 0.0001; ns, not significant.
Fig. 3
Fig. 3. PM2.5 Exposure Induces a Proteinase-Resistant, Highly Pathogenic αSyn Strain with Enhanced Neuropathology, Neurotoxicity, and Dementia-Inducing Potential.
(A) Insoluble fraction extraction schematic: 5-mon PM2.5-exposed hA53T (PM2.5-hA53T) mice vs. naturally aging symptomatic hA53T (Aged hA53T) mice. (B) ThT-mfi (max fluorescence intensity) of seeded αSyn: PM2.5-hA53T vs. Aged hA53T insoluble fractions in seeding amplification assay (SAA). (C) Dot blot: remaining αSyn after proteinase K (PK) digestion (0, 5, 15, 30 min) of PM2.5-hA53T and Aged hA53T insoluble fractions. (D) Quantification: remaining αSyn at 15 minutes PK digestion vs. 0 minute, PM2.5-hA53T vs. Aged hA53T. (E) PM-PFF and PFF generation schematic. (F) ThT-mfi: PM-PFF vs. PFF. (G) Dot blot: remaining αSyn after PK digestion (0, 5, 15, 30 minutes) of PFF and PM-PFF insoluble fractions. (H) Quantification: remaining αSyn at 15 minutes PK digestion vs. 0 minute, PFF vs. PM-PFF. (I) pS129-positive neuropathology in primary cortical neurons; n = 8. (J) Neurotoxicity (NeuN staining) in primary cortical neurons; n = 10. (K) In vivo protocol: striatal PM-PFF/PFF injection in 2-month-old hWT mice; behavior at 6 months, then euthanasia/staining. (L) Novel object recognition, (M) Nest building scores: PM-PFF/PFF injected mice at 6 months; n = 7–11. (N) Fluorescent images, (O) Quantification: cortical pS129 signals at 6 months post-injection (PBS, PFF, PM-PFF). (D, H, I, J, L, M, O) Data are presented as violin plots showing all individual data points. Statistics: (B, D, F, H) Means ± SEM, Student’s t-test; (I, J, L, M, O) Statistical significance was determined by using one-way ANOVA with Tukey’s correction; *p < 0.05, **p < 0.01, ****p < 0.0001; ns, not significant.
Fig. 4
Fig. 4. PM2.5-Induced αSyn Strain Shares Key Pathological Features with LBD Patient-Derived Strain and Maintains These Features Across Passages.
(A) Schematic of SAA comparing features of LBD patient cerebrospinal fluid (CSF) samples (n = 7 LBD [5 PDD, 2 DLB], n = 5 PD without dementia, n = 5 HC) and PM2.5-related mouse brain lysate samples (hWT mice inoculated with PM-PFF, PFF, or PBS, n = 5) using biophysical, biochemical, and cellular assays. 2nd passage samples (PM-PFF2nd, PFF2nd, PBS2nd) were derived from 1st passage inoculations. (B-G) Biochemical comparisons show highest ThT signal and strongest proteinase resistance in LBD αSyn strain vs. PD without dementia and HC, and in PM-PFF2nd vs. PFF2nd and PBS2nd. (H, I) pS129-positive pathology in primary cortical neurons treated with αSyn strains derived from HC, PD without dementia, and LBD, with corresponding quantification. (J, K) pS129-positive pathology in primary cortical neurons treated with PBS2nd, PFF2nd, PM-PFF2nd, with corresponding quantification. (L, M) Neurotoxicity in primary cortical neurons treated with αSyn strains from HC, PD without dementia, and LBD, with corresponding quantification. (N, O) Neurotoxicity in primary cortical neurons treated with PBS2nd, PFF2nd, PM-PFF2nd, with corresponding quantification. Statistics: (B, C) Means ± SEM, statistical significance was determined by using one-way ANOVA with Tukey’s correction with data at 7d; (E, G, I, K, M, O) Data are presented as violin plots showing all individual data points. Statistical significance was determined by using one-way ANOVA with Tukey’s correction; *p < 0.05, **p < 0.01, ***p < 0.001, ****p < 0.0001.
Fig. 5
Fig. 5. PM2.5 Exposure Induced Gene Expression Changes in Mice Resemble Those Observed in LBD Patients.
(A) Principal Component Analysis (PCA) of gene expression profiles shows clear separation between control samples and those exposed to four conditions: PM2.5, PFF, PM-PFF, and PM-PFF with PM2.5 exposure. PM: Nasal administration of PM2.5 to hWT mice for 2 months; PFF: Striatal injection of PFF into hWT mice, followed by 2-month observation; PM-PFF: Striatal injection of PM-PFF into hWT mice, followed by 2-month observation; PM-PFF with PM2.5 exposure: Striatal injection of PM-PFF into hWT mice, followed one week later by nasal administration of PM2.5 for 7 weeks (8 weeks total post-injection). (B) Tables comparing differentially expressed genes (DEGs) signatures between human diseases [DLB, PD without dementia, PDD] and mice condition [PM2.5, PFF, PM-PFF, PM-PFF with PM2.5 exposure]. The upper table illustrates the correlation of DEGs effect sizes between mice and humans, whereas the lower table shows the proportion of DEGs with consistent direction in effects. Color gradients represent significance levels as -log10(p-value), with white color indicating nominal significance (p = 0.05). (C) Scatter plot showing the correlation between DEGs effect sizes in PM2.5-exposed mice and those observed in PD without dementia, PDD and DLB patients. Each point represents a gene, with the x-axis indicating DEGs effects in humans and the y-axis indicating DEG effects in mice. The shaded area around the blue regression line represents the 95% confidence interval. (D) Scatter plot showing the correlation of DEGs effect sizes between PFF or PM-PFF-injected mice and those observed in DLB and PDD patients. (E) Venn diagram showing the overlap of dysregulated gene sets among PFF- or PM-PFF-injected mice and DLB and PDD patients.

References

    1. Chen H et al. , Living near major roads and the incidence of dementia, Parkinson’s disease, and multiple sclerosis: a population-based cohort study. The Lancet 389, 718–726 (2017). - PubMed
    1. Shi L et al. , A national cohort study (2000–2018) of long-term air pollution exposure and incident dementia in older adults in the United States. Nature communications 12, 6754 (2021). - PMC - PubMed
    1. Shi L et al. , Long-term effects of PM2· 5 on neurological disorders in the American Medicare population: a longitudinal cohort study. The Lancet Planetary Health 4, e557–e565 (2020). - PMC - PubMed
    1. Shi L et al. , Incident dementia and long-term exposure to constituents of fine particle air pollution: A national cohort study in the United States. Proceedings of the National Academy of Sciences 120, e2211282119 (2023). - PMC - PubMed
    1. Rampello L et al. , Dementia with Lewy bodies: a review. Archives of gerontology and geriatrics 39, 1–14 (2004). - PubMed

MeSH terms

LinkOut - more resources