. 2025 Sep 4;16(1):7033.
doi: 10.1038/s41467-025-62255-2.

Identification of Neuritin 1 as a local metabolic regulator of brown adipose tissue

Affiliations

Identification of Neuritin 1 as a local metabolic regulator of brown adipose tissue

Manuela Sánchez-Feutrie et al. Nat Commun. .

Abstract

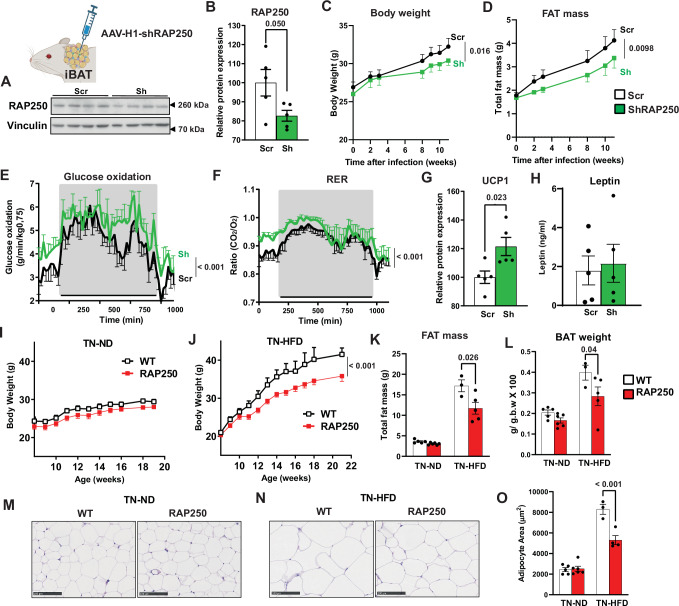
Brown adipose tissue (BAT) plays a key role in metabolic homeostasis through its thermogenic effects and the secretion of regulatory molecules. Here we report that RAP250 haploinsufficiency stimulates BAT in mice, thus contributing to a decrease in fat accumulation. Local in vivo AAV-mediated RAP250 silencing in BAT reduces body weight and fat mass and enhances glucose oxidation, thereby indicating that RAP250 participates in the regulation of BAT metabolic activity. Analysis of the mechanisms led to the finding that Neuritin 1 is produced and released by brown adipocytes, it plays a key metabolic role, and it participates in the enhanced BAT metabolic activity under RAP250 deficiency. Forced overexpression of Neuritin 1 in UCP1-expressing cells markedly decreases fat mass and body weight gain in mice and induces the expression of thermogenic genes in BAT. Neuritin 1-deficient brown adipocytes also shows a reduced β-adrenergic response. We demonstrate a metabolic role of BAT-derived Neuritin 1 acting through an autocrine/paracrine mechanism. Based on our results, Neuritin-1 emerges as a potential target for the treatment of metabolic disorders.


Conflict of interest statement

Competing interests: The authors declare no competing interests.

Figures

Fig. 1
Fig. 1. RAP250+/− mice show a lean phenotype.
A Body weight curves for 12- to 25-week-old male mice. Data are expressed as grams of body weight (WT n = 6, black open symbols; RAP250+/− n = 5, red symbols, and labeled as RAP250). B Food intake as grams of daily intake in 20- to 30-week-old mice (n = 11). C Inguinal adipose tissue (ING) and Perigonadal adipose tissue (PAT). Data are expressed as grams of tissue weight (n = 10). D Representative images of PAT and ING depots from WT and RAP250+/− male mice. E Transversal gray scale image of mouse abdominal region showing the subcutaneous adipose mass (SAT) and visceral adipose mass (VAT); vertebrae are seen as the denser white structures; least dense areas represent the adipose mass, and the layer that separates the visceral compartment from the subcutaneous region can be observed. F MicroCT adipose volume estimation of SAT, VAT and total abdominal adipose volume (n = 24) of 30-week-old male mice. Data are expressed as percentage of fat volume (femoral head to L5 vertebra). G Progression of total abdominal fat volume in time, measured by microCT Scan, in the same cohort of mice (10 weeks n = 8; 15 weeks n = 7; 30 weeks WT n = 24 and RAP250+/− n = 25; 40 weeks n = 10; 60 weeks n = 16 for WT and n = 11 for RAP250+/−; 85 weeks n = 8 for WT and n = 6 for RAP250+/−). H PAT paraffin slices stained with Hematoxylin/Eosin (scale bar=100 µm). I PAT adipocyte cell size of 30-week-old male mice (n = 5, 52–200 cells counted per animal). J Plasma leptin in 16-h fasted 30-week-old male mice (n = 22 for WT, n = 18 for RAP250+/). K Total DNA in ING and PAT depots of male mice. Data are expressed as μg of DNA per depot (in ING depots n = 9 for WT and n = 6 for RAP250+/−, in PAT depots n = 10 for WT and n = 7 for RAP250+/−). Data are MEAN+/− SEM. Statistical differences according to a two-sided Student´s t test (B, C, F, I, J and K) and Ordinary two-way ANOVA (A and G). Source data are provided as a Source Data file.
Fig. 2
Fig. 2. RAP250+/− mice show enhanced insulin sensitivity and are protected against insulin resistance induced by a high-fat diet.
A Fasting plasma glucose (mg/dl) (WT n = 18 and RAP250+/− n = 14) and B insulin (ng/ml) levels (WT n = 14 and RAP250+/− n = 13) of 30-week-old male mice under a normal diet ND. C Fasting plasma glucose (n = 12) and D insulin levels (WT n = 10 and RAP250+/− n = 12) of 30-week-old male mice under a high-fat diet (HFD). E Plasma glucose (time 0 to 60 min WT n = 23 and RAP250+/− n = 22; time 90 and 120 WT n = 15 and RAP250+/− n = 14) and F insulin profiles (time 0 to 30 min WT n = 14 and RAP250+/− n = 13; time 60 WT n = 5 and RAP250+/− n = 5)) upon glucose tolerance test (2 mg/kg) in male mice on a normal diet. G Plasma glucose (WT n = 13 and RAP250+/− n = 12) and H insulin profiles (WT n = 13 and RAP250+/− n = 10) under glucose tolerance test (2 mg/kg) in male mice after 16 weeks on a HFD (n = 12). I Whole-body glucose turnover (Turnover), hepatic glucose production (HGP), whole-body glucose infusion rate (GIR), whole-body glycolysis rate (Glycolysis), and whole-body glycogen synthesis rate (Glycogen synthesis) were measured in a 3-h hyperinsulinemic-euglycemic clamp (1.5 mU/kg/min insulin) in 30-week-old male mice (n = 9 for WT and n = 8 for RAP250+/−). J Hematoxylin/Eosin-stained paraffin slices of liver after 20 weeks of a HFD (scale bar=200 µm), and (K) Liver fat content as % of low density area (Lipid Droplets) over total histology slice area (n = 5, 25 slices per group). Data are MEAN+/− SEM. Statistical differences according to a two-sided Student´s t test (B, C, D, F, I and K) and Ordinary two-way ANOVA (E, G, and H). Source data are provided as a Source Data file.
Fig. 3
Fig. 3. RAP250 deficiency enhances energy expenditure and BAT activity.
A Whole-body oxygen consumption in male mice. Adjusted means based on a normalized mouse weight of 25.8071 g determined using ANCOVA (n = 8 for WT; n = 7 for RAP250+/). B Correlation between energy expenditure (kcal/h) and body weight (grams). Data were evaluated in dark phase in 30-week-old male mice on a normal diet (n = 8 for WT; n = 7 for RAP250+/). C Glucose oxidation profile over 24 h in 30-week-old male mice on a normal diet. Gray phase corresponds to dark phase. Data were evaluated in 30-week-old male mice on a normal diet (n = 8 for WT black symbols; n = 8 for RAP250+/− red symbols). D Brown adipose tissue weight. Data are expressed as percentage of tissue weight with respect total body weight (n = 5 for WT and n = 7 for RAP250+/−). E Glucose oxidation of isolated brown adipose cells (n = 9 from 3 independent experiments performed in triplicate). F Brown adipose tissue paraffin slices stained with Hematoxylin/Eosin (scale bar=100 µm) and lipid droplet size quantification (G). Data were evaluated in 20-week-old male mice (n = 5 for WT and n = 7 for RAP250+/−). H BAT sections stained with DAPI (blue), wheat germ agglutinin (WGA, green), and UCP1 (red). Scale bar 20 μm. I Quantification of adipocyte area and J quantification of UCP1 mean signal intensity (n = 3 for WT; n = 4 for RAP250+/−). K Heatmaps showing gene expression modulation in transcriptomic analysis performed in BAT from 20-week-old mice (n = 3 for WT and n = 4 for RAP250+/−). L Gene expression of brown adipogenic markers Pparg2, Prdm16, Cebpa, Ppara, Dio2, Ppargc1 and Ucp1 in BAT from 20-week-old mice. Data were normalized to ARP mRNA expression (n = 5 for WT, n = 7 for RAP250+/−). Representative images for UCP1, PPARγ, C/EBPα and α-Tubulin proteins in BAT extracts (M) from 20-week-old mice and quantification of protein expression (N). Data were normalized to α-Tubulin (n = 4 for WT, n = 7 for RAP250+/−). Data are MEAN+/− SEM. Statistical differences according to a two-sided Student´s t test (A, D, E, G, I, J, L and N) and Ordinary two-way ANOVA (C). Source data are provided as a Source Data file.
Fig. 4
Fig. 4. Specific RAP250 repression in BAT phenocopies many of the metabolic alterations of RAP250+/− mice, and thermoneutrality normalizes the metabolic alterations of RAP250+/− mice.
Representative image for RAP250 protein expression (A) and quantification (B) in BAT extracts from 32-week-old male mice 24 weeks after injection with Scr or ShRAP250 AAVs into BAT. Data were normalized to Vinculin (n = 5 for Scr and ShRAP250). Body weight (C) and total fat mass (D) curves after AAV administration into BAT (Scr, n = 5, black symbols; ShRAP250 n = 4, green symbols). Glucose oxidation (E) and RER (ratio CO2/O2) (F) over 24 h in 28-week-old male mice injected with Scr or ShRAP250 AAVs into BAT and on a normal diet. Gray phase corresponds to dark phase (n = 4 for WT; n = 4 for RAP250+/−). G UCP1 expression quantification in BAT extracts. Data were normalized to Vinculin (n = 5 for Scr and ShRAP250). H Plasma leptin from 16 h fasted mice (n = 5 for Scr and ShRAP250). Body weight curves from 8- to 22-week-old male mice subjected to thermoneutrality and on a normal chow diet (TN-ND) (I) or a high-fat diet (TN-HFD) (J). Data as grams of body weight (WT, n = 7; RAP250+/− n = 8 for TN-ND and WT, n = 4 and RAP250+/− n = 6 for TN-HFD). Black symbols for WT mice and red symbol for RAP250+/−. K Total fat mass from 22-week-old mice under TN-ND and from 20-week-old mice under TN-HFD. Data as grams of FAT (WT, n = 5, RAP250+/− n = 6 for TN-ND and WT, n = 3, RAP250+/− n = 5 for TN-HFD). L Brown adipose tissue weight. Data are expressed as percentage of tissue weight with respect total body weight (TN-ND WT, n = 5, RAP250+/− n = 6; TN-HFD WT n = 3, and RAP250+/− n = 5). Paraffin sections of PAT stained with Hematoxylin/Eosin for TN-ND (M) and TN-HFD (N) (scale bar=100 µm). O PAT adipocyte cell size of TN-ND (22-week-old) and TN-HFD (20-week-old) (WT TN-ND n = 5, RAP250 TN-ND n = 6, WT TN-HFD n = 3 and RAP250 TN-HFD n = 4, from 8−10 images per mouse). Data are MEAN+/− SEM. Statistical differences according to a two-sided Student´s t test (B and G) and Ordinary two-way ANOVA (C, D, E, F and J) and two-way ANOVA followed by Sidak’s multiple comparison test (K, L and O). A Created in BioRender. Bausa, O. (2025) https://BioRender.com/rdnlgxb. Source data are provided as a Source Data file.
Fig. 5
Fig. 5. Nrn1 is highly expressed in BAT from RAP250-deficient mice, and it is secreted upon catecholaminergic activation by brown adipose cells.
A Gene set enrichment analysis results of Regulation of action potential in neuron pathway (GO0019228) from Gene Ontology (GO) upregulated in BAT from RAP250+/− mice. B Heatmap of expression of specific neurotrophic and/or batokine genes in BAT from WT and RAP250 BAT (n = 3). Representative image for Tyrosine Hydroxylase (TH) expression (C) and quantification (D) in BAT extracts from 20 -week-old WT and RAP250-deficient mice (WT n = 7, RAP250+/− n = 6). E Percentage of non-myelinated Schwann cells in 20 -week-old WT and RAP250-deficient mice (n = 3). Representative image for NRN1 expression (F) and quantification (G) in BAT extracts from 20-week-old WT and RAP250-deficient mice (WT n = 4, RAP250+/− n = 6). H Nrn1 gene expression in BAT tissue from 2-, 4-, and 6-month-old WT and RAP250- deficient mice (2 m WT n = 11, RAP250+/− n = 12; 4 m WT n = 12, RAP250+/− n = 13; 6 m WT n = 4, RAP250+/− n = 5). NRN1protein quantification (Scr n = 3 and ShRAP250 n = 5) (I) and Nrn1 gene expression (Scr n = 6 and ShRAP250 n = 9) (J) in Scr or ShRAP250 AAVs into BAT. K Nrn1 gene expression in BAT from WT and RAP250-deficient mice at 22 °C and subjected to thermoneutrality (TN) (WT n = 4, RAP250+/− n = 5, WT TN n = 5, RAP250+/− TN n = 5). L Nrn1 and UCP1 mRNA expression during brown adipogenesis (d0 n = 3, d2 n = 2 and d4 n = 2 are from a representative experiment; for d10 n = 4 (UCP1 mRNA) and n = 6 (NRN1 mRNA) from 2 and 3 independent experiments performed by duplicate). M Representative image of NRN1 expression during brown adipogenesis at different days of differentiation (0, 2, 4, 6 and 10). N NRN1 expression in culture media from differentiated brown adipose cells under 2 hours of treatment without and with Isoproterenol (10uM). Data are expressed as total NRN1 in media (ng) corrected by total cell protein (mg) (Representative experiment performed in triplicate n = 3). Data are MEAN+/− SEM. Statistical differences according to a two-sided Student´s t test (D, E, G, H, I, J, K and N), and Enrichment score rotation based test (roastgsa) (A). Source data are provided as a Source Data file.
Fig. 6
Fig. 6. Enhanced expression of Neuritin-1 in thermogenic adipose cells stimulates brown adipose tissue metabolism.
A Nrn1 gene expression in BAT and SAT from mice injected via the tail-vein with either AAV-UCP1 empty (Control) or AAV-UCP1-NRN1 vector under UCP1 promoter (BAT AAV-Control n = 9; BAT AAV-UCP1-NRN1 n = 7; SAT AAV-Control n = 8, SAT AAV-UCP1-NRN1 n = 6). Body weight (time 0 Control n = 7 and NRN1 n = 10; time 30 Control n = 9 and NRN1 = 9) (B), total fat mass (n = 8) (C) and lean mass (n = 8) (D) graphs for mice before administration of an AAV Control or AAV-UCP1-NRN1 at time 0 (8-week-old mice) and 30 weeks after administration. Energy expenditure (E) and oxygen consumption (F) graphs during day and night periods in mice injected with AAV-Control or AAV-UCP1-NRN1 protein 26 weeks after infection (AAV-Control n = 7; AAV-UCP1-NRN1 n = 9). G Food intake as grams of daily intake in mice infected with AAV-control and AAV-UCP1-NRN1 (AAV-Control n = 7; AAV-UCP1-NRN1 n = 9). Brown adipose tissue paraffin slices stained with Hematoxylin/Eosin (H) (scale bar=100 µm) and lipid droplet size quantification (I). Data were evaluated 30 weeks after infection for Control and overexpressing NRN1 under UCP1 promoter mice (AAV-Control n = 8; AAV-UCP1-NRN1 n = 7). J BAT sections stained with DAPI (blue), wheat germ agglutinin (WGA, green), and UCP1 (red). Scale bar 20 μm. K Quantification of adipocyte area and (L) of UCP1 mean signal intensity (n = 4 for AAV-Control; n = 5 for AAV-UCP1-NRN1). M Gene expression for Prdm16, Ppargc1a, Ppargc1b, Cidea, Cpt1a, Lipe and Dio2 in BAT 30 weeks after AAV infection with Control or NRN1 under the UCP1 promoter. Data were normalized to ARP mRNA (n = 9 for AAV-Control; n = 7 for AAV-UCP1-NRN1). Representative images for p-HSL, HSL, UCP1, proteins phosphorylated by PKA substrates (p-PKA) and GAPDH proteins in BAT extracts 30 weeks after AAV infection with Control or NRN1 under the UCP1 promoter (N) and quantification (O). Data were normalized to GAPDH expression (n = 6 for AAV-Control; n = 7 for AAV-UCP1-NRN1). Data are MEAN+/− SEM. Data are MEAN+/− SEM. Statistical differences according to a two-sided Student´s t test for all figures except one-sided Student´s t test (K and L). A Created in BioRender. Bausa, O. (2025) https://BioRender.com/rdnlgxb. Source data are provided as a Source Data file.
Fig. 7
Fig. 7. Enhanced expression of Neuritin-1 in thermogenic adipose cells protects from HFD, promotes upregulation of many mitochondrial proteins and show similarity to the effects caused by chronic cold exposure.
A Nrn1 mRNA expression in BAT and SAT in mice injected via the tail-vein with either AAV Control or NRN1 vector under UCP1 promoter and subjected to a HFD for 15 weeks (AAV-Control n = 8, black symbols; AAV-UCP1-NRN1 n = 8, violet symbols). Body weight (B) and total fat mass (C) graphs for mice before administration of an AAV Control or NRN1 under the UCP1 promoter (AAV-UCP1-NRN1) at time 0 (8-week-old mice) and 3, 5, and 10 weeks after administration under HFD conditions (AAV-Control n = 8; AAV-UCP1-NRN1 n = 8). D Energy expenditure over 24 h in male mice infected with AAV empty vector or NRN1 under UCP1 on a HFD 13 weeks after administration. Gray phase corresponds to dark phase (AAV-Control n = 8; AAV-UCP1-NRN1 n = 7). E Oxygen consumption graph during day and night period in mice injected with AAV Control or AAV-UCP1-NRN1 (AAV-Control n = 8; AAV-UCP1-NRN1 n = 7). F Gene expression of Ucp1, Adrb3, Lipe and Cox8b in BAT 15 weeks after AAV infection with Control or NRN1 under the UCP1 promoter. Data were normalized to ARP mRNA (AAV-Control n = 8; AAV-UCP1-NRN1 n = 8). G and H Heatmaps showing z-scores of gene expression levels for Oxidative Phosphorylation (G) and Adipogenesis (H) Hallmarks in BAT from mice subjected to a normal diet infected with AAV empty vector or NRN1 under the control of the UCP1 promoter (n = 4 for Control and n = 5 for AAV-UCP1-NRN1). Color indicates (red: positive expression and blue: negative expression versus Control). Column p shows fold changes for individual genes. I Normalized scores of gene set enrichment analysis of top GO terms (Cellular Compartment) upregulated in BAT from mice AAV-NRN1 treated mice (adj. pval<0.05). In purple color, mitochondrial related pathways are shown. J Bubble chart of gene set enrichment analysis results showing pathways modified in response to NRN1 overexpression and upon cold exposure. Color indicates Normalized Enrichment Score (red: positive NES, blue: negative NES). Stars indicate p-value lower than 0.05. K Percentage of non-myelinated Schwann cells obtained by deconvolution analysis comparing control versus AAV-NRN1 treated mice in ND (AAV-Control n = 3; AAV-UCP1-NRN1 n = 5). Tyrosine Hydroxylase expression (L) and quantification (M) in BAT extracts from control and AAV-NRN1 treated mice in ND (AAV-Control n = 5; AAV-UCP1-NRN1 n = 7). Data are MEAN+/− SEM. Data are MEAN+/− SEM. Statistical differences according to a two-sided Student´s t test (AF, K and M). In figure J the bubble size indicates statistical significance (bigger = lower adjusted P value). Inner asterisk indicates adjusted P value < 0.05. Source data are provided as a Source Data file.
Fig. 8
Fig. 8. Neuritin1-deficient brown adipose cells show a reduced metabolic response to isoproterenol, diminished maximal respiration and mouse recombinant NRN1 protein promotes PKA activation and induction of CI-NDFUB8 respiratory subunit.
A Relative Nrn1 mRNA expression in Scr and siNRN1 preadipocytes. Data are from 3 separate differentiation experiments. B Representative imatge of PPARγ1 and γ2, UCP1, HSL and β-tubulin expression in Scr and siNRN1 brown adipocytes at day 10 of differentiation. p-HSL and phosphorylated by PKA substrates (p-PKA) expression (C) and quantification (D and E) in Scr and siNRN1 adipocytes (day 10 of differentiation), in basal and treated with Isoproterenol (10 μM) for 2 h (p-HSL n = 6 from 2 experiments performed in triplicate (p-HSL) and n = 3 from 1 representative experiment performed in triplicate (p-PKA)). Ppargc1a mRNA (F) and Ucp1 mRNA (G) expression in Scr and siNRN1 adipocytes cells, in basal and treated with isoproterenol (10 μM) for 2 h. Data are mean of 2 experiments performed in triplicate. H Seahorse representative experiments for Scr and siNRN1 brown adipocytes at day 10 of differentiation (Scr n = 4 and siNRN1 n = 5). I Mitochondrial respiration values referred to basal WT. Data are the mean of 5 independent experiments. J, K Expression (J) and quantification (K) of β3 Adrenergic Receptors in Scr and siNRN1 brown adipocytes at day 10 of differentiation. Data are mean of 4 independent experiments. L NRN1 SEC fractions run on 10% Bis-Tris NuPAGE Midi SDS-PAGE gels with MES running buffer. BenchMark protein markers (Invitrogen) were included for reference. M Abundance of PKA phosphorylated substrates (p-PKA) in brown adipocytes treated with 0.1, 0.5 and 1 μg/ml of recombinant NRN1 protein. N, O Ppargc1a (N) and Ucp1(O) mRNA expression in adipocytes treated with NRN1 (100 ng/ml) during 2 hours (n = 6 from 3 independent experiments). P Mitochondrial respiration values referred to basal WT respiration in untreated brown adipocytes non-treated (white bars) and cells treated with NRN1 at a concentration of 100 ng/ml (orange bars) from day 4 of differentiation (Representative experiment, Basal n = 7 and NRN1 treated adipocytes n = 8). Q, R Expression (Q) and quantification (R) of CI-NDUFB8 subunit in Scr adipocytes cells treated chronically with NRN1 (100 ng/ml) from day 4 of differentiation until day 10. Data are the mean of 3 independent experiments. Data are MEAN+/− SEM. Statistical differences according to a two-sided Student´s t test (A, I, K, N, O, P and Q) and two-way ANOVA followed by Sidak’s multiple comparison test (DF and G). Source data are provided as a Source Data file.

References

    1. Apovian, C. M. The clinical and economic consequences of obesity. Am. J. managed care19, s219–228 (2013). - PubMed
    1. Simonnet, A. et al. High Prevalence of Obesity in Severe Acute Respiratory Syndrome Coronavirus-2 (SARS-CoV-2) Requiring Invasive Mechanical Ventilation. Obesity28, 1195–1199 (2020). - PMC - PubMed
    1. Ayres, J. S. A metabolic handbook for the COVID-19 pandemic. Nat. Metab.2, 572–585 (2020). - PMC - PubMed
    1. Cypess, A. M. et al. Identification and importance of brown adipose tissue in adult humans. N. Engl. J. Med.360, 1509–1517 (2009). - PMC - PubMed
    1. Nedergaard, J., Bengtsson, T. & Cannon, B. Unexpected evidence for active brown adipose tissue in adult humans. Am. J. Physiol. Endocrinol. Metab.293, E444–452 (2007). - PubMed

LinkOut - more resources