. 2025 Sep 5;10(1):287.
doi: 10.1038/s41392-025-02376-8.

Targeting TRPV6/CXCR4 complexes prevents castration-resistant prostate cancer metastasis to the bone

Affiliations

Targeting TRPV6/CXCR4 complexes prevents castration-resistant prostate cancer metastasis to the bone

Clément Cordier et al. Signal Transduct Target Ther. .

Abstract

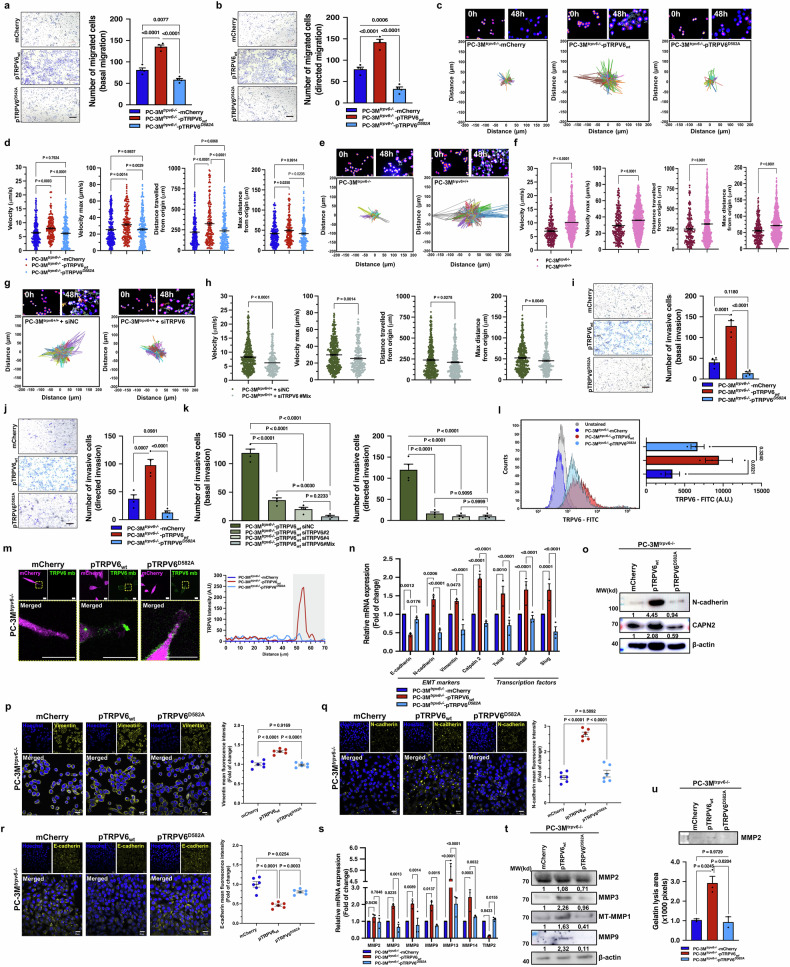
Bone metastasis most commonly occurs in castration-resistant prostate cancer (CRPC). The TRPV6 calcium channel is absent in healthy prostate tissue, but its expression increases considerably during cancer progression. We hypothesized that cancer cells induce TRPV6 expression de novo to directly benefit from tightly regulated calcium intake via TRPV6 while providing cancer cells with a selective advantage for metastasis in the calcium-abundant niche, such as bone. Using a cohort of prostate cancer tissue biopsies from patients with a clinical history of at least 10 years after biopsy, we report that TRPV6 expression directly correlates with CRPC tumor aggressiveness and increased risk of metastasis development. The TRPV6 channel is involved in the acquisition of both mesenchymal and invasive phenotypes through increased phosphorylation of CaMK2 followed by the translocation of the transcription factor NF-κB to the nucleus and the expression of EMT markers, MMPs, and transcription factors such as Twist, Snail, and Slug. Moreover, TRPV6 expression was accompanied by increased formation of CXCR4/TRPV6 complexes. In vivo, mice bearing trpv6+/+ tumors presented increased metastasis, notably bone metastasis, whereas trpv6-/- mice developed no metastasis. Targeting TRPV6 with a monoclonal antibody resulted in a significant reduction in the metastatic burden and an increase in overall survival. When AMD3100, a selective inhibitor of the CXCR4 receptor, was combined with AMD3100, a synergistic effect on the suppression of metastasis development was achieved. Thus, the suppression of CRPC metastasis to bone can be achieved via simultaneous targeting of TRPV6/CXCR4, demonstrating that combined therapy is a proof-of-concept approach in vivo.


Conflict of interest statement

Competing interests: The authors (A.H., N.P., and V.L.) have a patent application, EP21306238, related to the use of the monoclonal antibody anti-TRPV6. The authors declare that the research was conducted in the absence of any commercial or financial relationships that could be construed as potential conflicts of interest.

Figures

Fig. 1
Fig. 1
Human TRPV6 expression in prostate metastatic cancer. a Expression intensity of the trpv6 gene from published gene expression datasets (GEO: GSE32571; GSE32269; GSE77930). PTT: peritumoral tissue; CaM: PCa metastasis; CRPC (bone): bone metastasis from castration-resistant prostate cancer (CRPC); NBM: normal bone marrow. b OS as a function of TRPV6 expression: no TRPV6 staining (n = 1); weak and moderate TRPV6 staining (n = 24); and strong TRPV6 staining (n = 12) in human patients according to the log rank (Mantel‒Cox) test. c Clinical history of 37 human patients with prostate cancer biopsies: n.a. not available; Mb. membrane; Ap. apical; Cy. cytosolic staining. d Representative images of both H&E and TRPV6 staining in prostate tumor biopsies: peritumoral tissue (PTT) (n = 22), adenocarcinomas (ADCs) with Gleason scores of 3 + 3 (n = 14), Gleason scores of 3 + 4 (n = 4), Gleason scores of 4 + 3 (n = 4), and Gleason scores ≥ 8 (n = 15). Scale bar, 100 μm. e Quantification of TRPV6 staining intensities in prostate tumor biopsies from (d). f Localization of TRPV6 staining in prostate tumor biopsies from (d). g Overall survival rate of 0–20% of TRPV6-positive adenocarcinomas (n = 16), 20–40% of TRPV6-positive adenocarcinomas (n = 8), and 40–100% of TRPV6-positive adenocarcinomas (n = 13) in human patients according to the log-rank (Mantel–Cox) test. h 10-year survival rate of patients following biopsy according to TRPV6 staining. i OS of human patients according to the H score, according to the log rank (Mantel‒Cox) test: 0–20 (n = 12), 20–80 (n = 13), and 80–300 (n = 12). j Ten-year death and survival rates compared with the percentage of TRPV6-positive adenocarcinomas in the biopsies. k The 10-year death and survival rates compared with the H-scores of the biopsies were determined via an arbitrary score. l Clinical history of 7 patients with bone metastasis originating from prostate cancer. n.a. not available. m Representative images of both NKX3.1 and TRPV6 staining in bone metastases of prostate tumor origin via differentiation stage-matched intensity comparisons. Scale bars, 100 μm. n Metastasis-free survival of human patients according to arbitrary scores of 0–20 (n = 12), 20–80 (n = 13), and 80–300 (n = 12) according to the log rank (Mantel‒Cox) test. Mean ± SEM (a, h, j, k). Two-tailed t test (a, h, j, k). Two-way ANOVA (a). Log rank (Mantel‒Cox) test (b, g, i, n)
Fig. 2
Fig. 2
TRPV6 is involved in cancer cell migration and invasion in vitro. a Basal migration of PC-3Mtrpv6−/−-mCherry, PC-3Mtrpv6−/−-pTRPV6wt, and PC-3Mtrpv6−/−-pTRPV6D582A stable cell clones. Representative images and quantification of migrated cells (n = 4). Scale bar, 200 μm. b Directed migration of PC-3Mtrpv6−/−-mCherry, PC-3Mtrpv6−/−-pTRPV6wt, and PC-3Mtrpv6−/−-pTRPV6D582A stable cell clones shown as representative images and quantification of migrated cells (n = 4). Scale bar, 200 μm. c Tracking of PC-3Mtrpv6−/−-mCherry (n = 29), PC-3Mtrpv6−/−-pTRPV6wt (n = 46), and PC-3Mtrpv6−/−-pTRPV6D582A (n = 30) stable cell clones for 48 h. d Quantification of both the cell velocity and distance of stable cell clones from (c). e PC-3Mtrpv6−/− (n = 63) and PC-3Mtrpv6+/+ (n = 115) cells were tracked for 48 h. f Quantification of both the cell velocity and distance of prostate cancer cells from (e). g Tracking of PC-3Mtrpv6+/+ cells treated with 40 nM of either the negative control siRNA (n = 86) or a mixture of siRNAs against TRPV6 (n = 46) for 48 h. h Quantification of both the cell velocity and distance of prostate cancer cells from (g). i Basal invasion of PC-3Mtrpv6−/−-mCherry, PC-3Mtrpv6−/−-pTRPV6wt, and PC-3Mtrpv6−/−-pTRPV6D582A stable cell clones shown as representative images and quantification of migrated cells (n = 4). Scale bar, 200 μm. j Directed invasion of PC-3Mtrpv6−/−-mCherry, PC-3Mtrpv6−/−-pTRPV6wt, and PC-3Mtrpv6−/−-pTRPV6D582A stable cell clones shown as representative images and quantification of migrated cells (n = 4). Scale bar, 200 μm. k Basal and direct invasion of PC-3Mtrpv6−/−-pTRPV6wt cells treated with 40 nM control (siNC) or specific siTRPV6. Quantification of invasive cells (n = 4). l Flow cytometry analysis of cell surface TRPV6 expression in PC-3Mtrpv6−/−-mCherry (n = 29), PC-3Mtrpv6−/−-pTRPV6wt (n = 46), and PC-3Mtrpv6−/−-pTRPV6D582A stable cell clones. m TRPV6 channel targeting the plasma membrane in the regions of cell protrusions in PC-3Mtrpv6−/−-mCherry, PC-3Mtrpv6−/−-pTRPV6wt, and PC-3Mtrpv6−/−-pTRPV6D582A stable cell clones. Scale bars, 100 μm. n EMT marker and transcription factor expression via qPCR in PC-3Mtrpv6−/−-mCherry, PC-3Mtrpv6−/−-pTRPV6wt, and PC-3Mtrpv6−/−-pTRPV6D582A stable cell clones (n = 3). o Western blot analysis of N-cadherin and calpain-2 proteins expression in PC-3Mtrpv6−/− and PC-3M-luc-C6trpv6+/+ stable cell clones compared with TRPV6 expression. p Vimentin staining in PC-3Mtrpv6−/−-mCherry, PC-3Mtrpv6−/−-pTRPV6wt, and PC-3Mtrpv6−/−-pTRPV6D582A stable cell clones with the quantification of the mean intensity reported via Hoechst staining (n = 6). Scale bar, 20 μm. q N-cadherin staining in PC-3Mtrpv6−/−-mCherry, PC-3Mtrpv6−/−-pTRPV6wt, and PC-3Mtrpv6−/−-pTRPV6D582A stable cell clones with the quantification of the mean intensity reported via Hoechst staining (n = 6). Scale bar, 20 μm. r E-cadherin staining in PC-3Mtrpv6−/−-mCherry, PC-3Mtrpv6−/−-pTRPV6wt, and PC-3Mtrpv6−/−-pTRPV6D582A stable cell clones with the quantification of the mean intensity reported via Hoechst staining (n = 6). Scale bar, 20 μm. s MMPs and TIMP2 expression via qPCR in PC-3Mtrpv6−/−-mCherry, PC-3Mtrpv6−/−-pTRPV6wt, and PC-3Mtrpv6−/−-pTRPV6D582A stable cell clones (n = 3). t Protein expression of the MMP2, MMP3, MT-MMP1, and MMP9 proteins in PC-3Mtrpv6-/- and PC-3M-luc-C6trpv6+/+ stable cell clones compared with β-actin expression and TRPV6 status. u 1% gelatin zymography analysis and quantification of MMP2 in the conditioned media of PC-3Mtrpv6−/−-mCherry, PC-3Mtrpv6−/−-pTRPV6wt, and PC-3Mtrpv6−/−-pTRPV6D582A stable cell clones. Mean ± SEM (a, b, d, f, h–l, n, p–s, u). Two-tailed t-test (f, h). Two-way ANOVA (a, b, d, i–l, n, p–s, u). See also Supplementary Figs. 1 and 2
Fig. 3
Fig. 3
p-CaMK2 and NF-κB/RelA are involved in TRPV6-mediated signaling. a Heatmap of gene expression involved in basal migration via the focal adhesion pathway of the KEGG database with log2FC values in PC-3Mtrpv6−/−-pTRPV6wt and PC-3Mtrpv6−/−-pTRPV6D582A versus PC-3Mtrpv6−/−-mCherry stable cell clones. b Heatmap of key proteins involved in cytoskeleton phosphorylation with relative phosphorylation values in PC-3Mtrpv6−/−-pTRPV6wt versus PC-3Mtrpv6−/−-mCherry stable cell clones. c Heatmap of gene expression shown in b with log2FC values in PC-3Mtrpv6−/−-pTRPV6wt and PC-3Mtrpv6−/−-pTRPV6D582A versus PC-3Mtrpv6−/−-mCherry stable cell clones. d Protein expression of p-CaMK2 (Thr287) and CaMK2 proteins in different PC-3M and PC-3M-luc-C6 cell clones with various channel expression levels. e p-CaMK2 (Thr287) staining in PC-3Mtrpv6−/− and PC-3M-luc-C6trpv6+/+ prostate cancer cell lines and quantification of the mean intensity reported with Hoechst (n = 6). Scale bar, 20 μm. f Directed migration and invasion of PC-3Mtrpv6+/+ cells treated with the CaMK2 inhibitor KN-93 (10 or 20 μM) or vehicle. Representative images (left) and quantification of the number of cells that migrated and invaded through the matrix (right) (n = 4). Scale bar, 200 μm. g Directed migration and invasion of PC-3Mtrpv6−/−-pTRPV6wt cells treated with the CaMK2 inhibitor KN-93 (10 or 20 μM) or vehicle. Representative images (left) and quantification of the number of cells that migrated and invaded through the matrix (right) (n = 4). Scale bar, 200 μm. h Directed migration and invasion of PC-3M-luc-C6trpv6+/+ cells treated with the CaMK2 inhibitor KN-93 (10 or 20 μM) or vehicle. Representative images (left) and quantification of the number of cells that migrated and invaded through the matrix (right) (n = 4). Scale bar, 200 μm. i Directed migration and invasion of PC-3M-luc-C6trpv6+/+ -pTRPV6wt stable clone cells treated with the CaMK2 inhibitor KN-93 (10 or 20 μM) or vehicle. Representative images (left) and quantification of the number of cells that migrated and invaded through the matrix (right) (n = 4). Scale bar, 200 μm. j NF-κB/RelA staining of PC-3Mtrpv6−/− and PC-3M-luc-C6trpv6+/+ cells with various TRPV6 expression levels treated with KN-93 (10 μM) or vehicle and quantification of nuclear-positive cells (n = 6). Scale bar, 20 µm. k Nuclear NF-κB protein activity in different PC-3Mtrpv6−/− stable cell clones determined via a luciferase assay. l Detection of p-IκB (S32) and IκB proteins via ELISA in lysates of PC-3Mtrpv6−/− and PC-3M-luc-C6trpv6+/+ cells with different channel expression levels as well as following treatment with the CaMK2 inhibitor KN-93 (10 μM), where the levels in the controls were normalized to 1. m Directed migration and invasion of PC-3Mtrpv6−/− -pTRPV6wt cell clones transfected with 40 nM SMARTpool against relA or a negative control (NC). Representative images and quantification of migrated and invasive cells (n = 4). Scale bar, 200 μm. n Directed migration and invasion of PC-3M-luc-C6trpv6+/+-pTRPV6wt cell clones transfected with either 40 nM SMARTpool against relA or a negative control (NC). Representative images and quantification of migrated and invasive cells (n = 4). Scale bar, 200 μm. o Expression of genes involved in invasion and EMT in PC-3Mtrpv6-/--pTRPV6wt cells transfected with 40 nM SMARTpool against relA or a negative control (NC). p Expression of genes involved in invasion and EMT in PC-3M-luc-C6trpv6+/+-pTRPV6wt cells transfected with either 40 nM SMARTpool against relA or a negative control (NC). Mean ± SEM (ep). Two-sided t test (e, jp). Two-way ANOVA (fi, k, l). See also Supplementary Fig. 3
Fig. 4
Fig. 4
TRPV6 involvement in prostate cancer metastasis formation in vivo. a Timeline of the experimental design of the metastasis model in which PC-3Mtrpv6−/−-mCherry and PC-3Mtrpv6−/−-pTRPV6wt stable clones (both expressing mCherry) were subcutaneously grafted into Swiss-nude mice. b Overall survival of mice bearing PC-3Mtrpv6−/−-mCherry (n = 7) and PC-3Mtrpv6−/−-pTRPV6wt grafted cells (n = 7) before excision of the primary tumor via the log rank (Mantel‒Cox) test. c Representative images of mice bearing primary tumors before excision (left) and representative images of mCherry fluorescence time latches of emerging metastases under both conditions. d Percentages of metastasis incidence in PC-3Mtrpv6−/−-mCherry (n = 7)- and PC-3Mtrpv6−/−-pTRPV6wt (n = 7)-grafted mice after excision of the primary tumor as described in (c). e Metastasis-free survival of the PC-3Mtrpv6−/−-mCherry (n = 7) and PC-3Mtrpv6−/−-pTRPV6wt (n = 7) groups was evaluated via the log-rank (Mantel‒Cox) test. f Metastatic growth following the excision of primary tumors from PC-3Mtrpv6−/−-mCherry (n = 7) and PC-3Mtrpv6−/−-pTRPV6wt (n = 7) grafted cells. g Representative images and quantification of TRPV6 expression in primary tumor xenografts and corresponding nonbone metastases from the same mice bearing PC-3Mtrpv6−/−-pTRPV6wt grafted cells (n = 6). Scale bars, 20 µm. h Representative images and quantification of p-CaMK2 (Thr287) in primary tumor xenografts from PC-3Mtrpv6−/−-mCherry and PC-3Mtrpv6−/−-pTRPV6wt grafted mice. Scale bars, 20 µm. i Representative images and quantification of NF-κB/RelA in primary tumor xenografts from PC-3Mtrpv6−/−-mCherry and PC-3Mtrpv6−/−-pTRPV6wt grafted mice. Scale bars, 20 µm. j Representative images and quantification of TRPV6, FAK, Integrin β1, cathepsin B, cathepsin D and VEGF expression in addition to H&E staining of primary tumor xenografts from mice bearing PC-3Mtrpv6−/−-mCherry (n = 7) and PC-3Mtrpv6-/--pTRPV6wt stable clones. Scale bar, 200 μm. k Timeline of the experimental design of the metastasis model in which PC-3Mtrpv6−/−-pTRPV6wt stable clones expressing mCherry were subcutaneously grafted into Swiss-nude mice following intraperitoneal treatment with either 100 µg/kg mAbAU1 or mAb82. l Representative image of a mouse bearing primary tumors before excision (left) and representative mCherry fluorescence imaging time-lapse images of emerging metastases derived from PC-3Mtrpv6−/−-pTRPV6wt grafted cells following treatment with either 100 µg/kg mAbAU1 or mAb82. m Percentage of metastasis incidence in the PC-3Mtrpv6−/− pTRPV6wt mouse group after excision of the primary tumor and following treatment with either 100 µg/kg mAbAU1 (n = 7) or mAb82 (n = 7). n Metastasis-free survival of PC-3Mtrpv6−/−-pTRPV6wt-grafted mice treated with either 100 µg/kg mAbAU1 (n = 7) or mAb82 (n = 7) determined via the log rank (Mantel‒Cox) test. o Metastatic growth after the excision of primary tumors derived from PC-3Mtrpv6−/−-pTRPV6wt grafted mice treated with either 100 µg/kg mAbAU1 (n = 7) or mAb82 (n = 7). p Representative images and quantification of the TRPV6 channel in both primary tumor xenografts and corresponding metastases from the same mice bearing PC-3Mtrpv6−/−-pTRPV6wt grafted cells and treated with either 100 µg/kg mAbAU1 (n = 7) or mAb82 (n = 7). Scale bars, 20 µm. q Representative staining and quantification of TUNEL-fluorescein-positive cells in primary tumor xenografts and their corresponding metastases from mice bearing PC-3Mtrpv6-/--pTRPV6wt cells and treated with either 100 µg/kg mAbAU1 (n = 3) or mAb82 (n = 3). Scale bars, 20 µm. r Representative images and quantification of p-CaMK2 (Thr287) in primary tumor xenografts and their corresponding metastases from mice bearing PC-3Mtrpv6−/−-pTRPV6wt cells and treated with either 100 µg/kg mAbAU1 (n = 3) or mAb82 (n = 3). Scale bars, 20 µm. s Representative staining and quantification of NF-κB/RelA in primary tumor xenografts and their corresponding metastases from mice bearing PC-3Mtrpv6−/−-pTRPV6wt cells and treated with either 100 µg/kg mAbAU1 (n = 3) or mAb82 (n = 3). Scale bars, 20 µm. t Representative staining and quantification of TRPV6, FAK, Integrin β1, cathepsin B, cathepsin D and VEGF in addition to H&E staining of primary tumor xenografts from mice bearing PC-3Mtrpv6−/−-pTRPV6wt tumors treated with 100 μg/kg mAbAU1 or mAb82. Scale bar, 200 μm. Mean ± SEM (fj, ot). Two-tailed t test (gj, pt). Log rank (Mantel‒Cox) test (b, e, n)
Fig. 5
Fig. 5
TRPV6 is directly involved in bone metastasis by coupling with the CXCR4 receptor. a Timeline of the experimental design of the bone metastasis model using Swiss-nude mice bearing either PC-3M-luc-C6trpv6+/+-mCherry or PC-3M-luc-C6trpv6+/+-pTRPV6wt cell clones stably expressing firefly luciferase. I.C.: intracardiac. b Overall survival of PC-3M-luc-C6trpv6+/+-mCherry (n = 9) versus PC-3M-luc-C6trpv6+/+-pTRPV6wt (n = 9) mice via the log rank (Mantel‒Cox) test. c Representative bioluminescence and X-ray images of mice prior to injection (left) and representative bioluminescence images and X-ray time latches of emerging bone metastases derived from PC-3M-luc-C6trpv6+/+-mCherry (n = 9) versus PC-3M-luc-C6trpv6+/+ -pTRPV6wt (n = 9) cell clones grafted via intracardiac injection. d Percentage of metastasis incidence in mice bearing PC-3M-luc-C6trpv6+/+-mCherry (n = 9) versus PC-3M-luc-C6trpv6+/+-pTRPV6wt (n = 9) grafted cells. e Comparison of the metastasis-free survival of PC-3M-luc-C6trpv6+/+-mCherry (n = 9) and PC-3M-luc-C6trpv6+/+-pTRPV6wt (n = 9) grafted mice via the log rank (Mantel‒Cox) test. f Representative X-ray image of mouse bone macrometastasis (black arrows) following intracardiac injection of PC-3M-luc-C6trpv6+/+-mCherry or PC-3M-luc-C6trpv6+/+-pTRPV6wt cell clones. g Incidence of bone macrometastasis in mice grafted via intracardiac injections of either PC-3M-luc-C6trpv6+/+-mCherry (n = 9) or PC-3M-luc-C6trpv6+/+-pTRPV6wt (n = 9) cell clones, as revealed via X-ray analysis or surgery. h Representative staining of TRPV6, CXCR4, and pankeratin as well as histological staining by H&E and Masson–Goldner’s trichrome in bone metastases (black triangles) from both the ribs and legs derived from intracardiac injections of either PC-3M-luc-C6trpv6+/+-mCherry or PC-3M-luc-C6trpv6+/+-pTRPV6wt cell clones. The dotted rectangle represents the area used for zooming in on TRPV6 and CXCR4 staining. M: muscle. PCa: prostate cancer. B: bone. BM: bone marrow. A: Adipocytes. Black scale bars, 100 μm; red scale bars, 50 μm. i Quantification of both TRPV6- and CXCR4-positive cells involved in bone metastasis was performed following intracardiac injections of either PC-3 M-luc-C6trpv6+/+-mCherry or PC-3M-luc-C6trpv6+/+-pTRPV6wt cell clones. j Membrane and total protein expression of CXCR4 in PC-3Mtrpv6−/−-mCherry, PC-3Mtrpv6−/−-pTRPV6wt, and PC-3Mtrpv6−/−-pTRPV6D582A stable cell clones. k Flow cytometric analysis of membrane CXCR4 expression in PC-3Mtrpv6−/−-mCherry, PC-3Mtrpv6−/−-pTRPV6wt, and PC-3Mtrpv6−/−-pTRPV6D582A stable cell clones. l Membrane and total protein expression of CXCR4 in PC-3M-luc-C6trpv6+/+-mCherry versus PC-3M-luc-C6trpv6+/+-pTRPV6wt cell clones. m Flow cytometric analysis of membrane CXCR4 expression in PC-3M-luc-C6trpv6+/+-mCherry versus PC-3M-luc-C6trpv6+/+ -pTRPV6wt cell clones. n Membrane and total protein expression of CXCR4 in PC-3M-luc-C6trpv6-/- versus PC-3M-luc-C6trpv6+/+ cells. o Flow cytometric analysis of membrane CXCR4 expression in PC-3M-luc-C6trpv6-/- versus PC-3M-luc-C6trpv6+/+ cells. p Representative images and quantification (on the right) of TRPV6/CXCR4 coupling via the PLA in PC-3Mtrpv6−/−-mCherry, PC-3Mtrpv6−/−-pTRPV6wt, and PC-3Mtrpv6−/−-pTRPV6D582A stable cell clones; PC-3M-luc-C6trpv6+/+-mCherry versus PC-3M-luc-C6trpv6+/+-pTRPV6wt cell clones; and PC-3M-luc-C6trpv6−/− versus PC-3M-luc-C6trpv6+/+ cells. Scale bars, 10 μm. q Directed migration and invasion of PC-3M-luc-C6trpv6+/+-mCherry versus PC-3M-luc-C6trpv6+/+-pTRPV6wt cell clones treated with the specific CXCR4 inhibitor AMD3100 (30 μM) or vehicle to study the impact of CXCL12 as a chemoattractant (100 ng/mL). Representative images (left) and quantification of the number of cells that migrated and invaded through the matrix (right) (n = 3). Scale bar, 200 μm. Mean ± SEM (i, k, m, o–q). Two-tailed t test (d, g, i, m, o, p). Two-way ANOVA (k, q). Log rank (Mantel‒Cox) test (b, e). See also Supplementary Fig. 6
Fig. 6
Fig. 6
Effect of TRPV6 expression on bone metastasis development and bone architecture in vivo. a Timeline of the experimental bone-homing model using PC-3M-luc-C6trpv6+/+-mCherry and PC-3M-luc-C6trpv6+/+-pTRPV6wt cell clones stably expressing firefly luciferase in Swiss-nude mice. I.O.: intraosseous. b Representative bioluminescence images and X-rays of mice bearing metastases from grafted i.o. PC-3M-luc-C6trpv6+/+-mCherry and PC-3M-luc-C6trpv6+/+-pTRPV6wt cell clones. c Bone metastasis growth expressed as total photon flux in mice bearing intraosseous xenografts of PC-3M-luc-C6trpv6+/+ -mCherry (n = 10) and PC-3M-luc-C6trpv6+/+ -pTRPV6wt (n = 10). d Representative images of Masson-Goldner’s trichrome, pankeratin, Ki67, TRPV6 and CXCR4 staining in tibias from mice bearing intraosseous xenografts of PC-3M-luc-C6trpv6+/+-mCherry and PC-3M-luc-C6trpv6+/+-pTRPV6wt. Black scale bar, 2 mm. White scale bars, 20 μm. e and f 3D images of both the trabecular (e) and cortical (f) bone microarchitectures of the tibia and the BV/TV ratio, trabecular separation, trabecular number and trabecular thickness, cortical/total cross-sectional area, cortical thickness, total volume of pores, and total porosity expressed over the right tibia (control injection of PBS) of mice bearing intraosseous xenografts of PC-3M-luc-C6trpv6+/+-mCherry and PC-3M-luc-C6trp6+/+-pTRPV6wt cell clones. g Timeline of the experimental bone-homing model using PC-3M-luc-C6trpv6−/− and PC-3M-luc-C6trpv6+/+ cell clones stably expressing firefly luciferase in Swiss-nude mice. I.O.: intraosseous. h Representative bioluminescence images and X-rays of mice bearing metastases derived from intraosseous xenografts of PC-3M-luc-C6trpv6−/− and PC-3 M-luc-C6trpv6+/+ cell clones. i Bone metastasis growth expressed as total photon flux in mice bearing intraosseous xenografts of PC-3M-luc-C6trpv6−/− (n = 10) and PC-3M-luc-C6trpv6+/+ (n = 10) mice. j Representative Masson–Goldner’s trichrome, pankeratin, Ki67, TRPV6 and CXCR4 staining of tibias from mice bearing intraosseous xenografts of PC-3M-luc-C6trpv6−/− and PC-3M-luc-C6trpv6+/+ cell clones. Black scale bars, 2 mm. White scale bars, 20 μm. k and l 3D images of both the trabecular (k) and cortical (l) bone microarchitectures at the tibia and the BV/TV ratio, trabecular separation, trabecular number and trabecular thickness, cortical/total cross-sectional area ratio, cortical thickness, total volume of pores, and total porosity expressed over the right tibia (control injection of PBS) of mice bearing intraosseous xenografts of PC-3M-luc-C6trpv6−/− or PC-3M-luc-C6trpv6+/+ cells. Mean ± SEM (c, e, f, i, k, l). Two-sided t test (c, e, f, i, k, l). See also Supplementary Fig. 7
Fig. 7
Fig. 7
TRPV6 targeting via an anti-TRPV6 monoclonal antibody suppresses bone metastasis in vivo. a Timeline of the experimental bone metastasis model using Swiss mice grafted with PC-3M-luc-C6trpv6+/-pTRPV6WT cell clones stably expressing firefly luciferase and treated with either 100 µg/kg mAbAU1 or mAb82 24 h before intracardiac cell injection, followed by treatment with either 100 µg/kg mAbAU1 or mAb82 twice per week starting 24 h after intracardiac cell injection. I.C.: intracardiac. b Overall survival of mice bearing PC-3M-luc-C6trpv6+/+ -pTRPV6wt cell clones and treated with either 100 µg/kg mAbAU1 (n = 14) or mAb82 (n = 14) 24 h after intracardiac cell injection, as determined via the log rank (Mantel‒Cox) test. c Representative bioluminescence images and X-rays of mice grafted with PC-3M-luc-C6trpv6+/+-pTRPV6wt cell clones and treated with either 100 µg/kg mAbAU1 (n = 14) or mAb82 (n = 14) 24 h after intracardiac cell injection. d Incidence of bone metastasis in mice grafted with PC-3M-luc-C6trpv6+/+-pTRPV6wt cell clones and treated with either 100 µg/kg mAbAU1 (n = 14) or mAb82 (n = 14) 48 h after intracardiac cell injection. e Survival of PC-3M-luc-C6trpv6+/+ -pTRPV6wt mice and mice treated with either 100 µg/kg mAbAU1 (n = 14) or mAb82 (n = 14) 24 h after intracardiac cell injection, as determined via the log rank (Mantel‒Cox) test. f Representative bioluminescence imaging and X-ray images of mice bearing metastases on the last day of treatment with either 100 µg/kg mAbAU1 or mAb82 (left) and representative H&E, Masson–Goldner’s trichrome and TRPV6 staining of bone metastases (right) from these mice. PCa: prostate cancer. B: bone. BM: bone marrow. Black scale bars, 100 µm. White scale bars, 20 µm. g Timeline of the experimental bone metastasis model using Swiss mice grafted with PC-3M-luc-C6trpv6+/+-pTRPV6wt cell clones stably expressing firefly luciferase and treated with either 600 µg/kg mAbAU1 or mAb82 24 h before intracardiac cell injection, followed by treatment with either 100 µg/kg mAbAU1 or mAb82 twice per week starting 24 h after intracardiac cell injection. I.C.: intracardiac. h Overall survival of mice bearing PC-3 M-luc-C6trpv6+/+ -pTRPV6wt cell clones and treated with either 600 µg/kg mAbAU1 (n = 12) or mAb82 (n = 12) 24 h before intracardiac cell injection and then treated with either 100 µg/kg mAbAU1 or mAb82 twice per week starting 24 h after intracardiac cell injection, as determined via the log rank (Mantel‒Cox) test. i Representative bioluminescence imaging and X-ray images of mice grafted with PC-3M-luc-C6trpv6+/+-pTRPV6wt cell clones and treated with either 600 µg/kg mAbAU1 (n = 12) or mAb82 (n = 12) 24 h before intracardiac cell injection, followed by treatment with either 100 µg/kg mAbAU1 or mAb82 twice per week starting 24 h after intracardiac cell injection. j Metastasis-free survival of mice bearing PC-3M-luc-C6trpv6+/+-pTRPV6wt and treated with either 600 µg/kg mAbAU1 (n = 12) or mAb82 (n = 12) 24 h before intracardiac cell injection and then treated with either 100 µg/kg mAbAU1 or mAb82 twice per week starting 24 h after intracardiac cell injection, as determined via the log rank (Mantel‒Cox) test. k Incidence of bone metastasis in mice bearing PC-3M-luc-C6trpv6+/+-pTRPV6wt and treated with either 600 µg/kg mAbAU1 (n = 12) or mAb82 (n = 12) 24 h before intracardiac cell injection, as determined via the log rank (Mantel‒Cox) test. l Representative H&E and Masson–Goldner’s Trichrome staining of bone metastases derived from the ribs of mice treated with either mAbAU1- or mAb82-treated mice as described in (a). PCa: prostate cancer. B: bone. BM: bone marrow. Scale bars, 100 µm. m Timeline of the experimental tumor growth model using PC-3M-luc-C6trpv6+/+ cells stably expressing luciferase in Swiss-nude mice treated with either 100 µg/kg AU1 or mAb82 together with 5 mg/kg AMD3100 following tumor formation. S.C.: Subcutaneous. I.P.: Intraperitoneal. n Representative bioluminescence images of mice bearing xenografts of PC-3M-luc-C6trpv6+/+ cells treated with either 100 µg/kg mAbAU1 or mAb82 together with 5 mg/kg AMD3100 following tumor formation. o Tumor growth in mice bearing xenografts of PC-3M-luc-C6trpv6+/+ cells treated with either 100 µg/kg mAbAU1 or mAb82 together with 5 mg/kg AMD3100 following tumor formation. p Representative H&E, TRPV6, CXCR4, Ki-67 and TUNEL-fluorescein staining of primary tumors from mice bearing xenografts of PC-3M-luc-C6trpv6+/+ cells treated with either 100 µg/kg mAbAU1 or mAb82 together with 5 mg/kg AMD3100 following tumor formation. Scale bar, 20 µm. q Survival assay (MTS) of PC-3M-luc-C6trpv6+/+ cells treated with either 6 µg/mL mAbAU1/mAb82 together with 30 mM AMD3100 for 4 days. r Annexin V-FITC and IP analysis and quantification via flow cytometry of PC-3M-luc-C6trpv6+/+ cells treated with either 6 µg/mL mAbAU1/mAb82 or 30 mM AMD3100 for 3 days. s Survival assay (MTS) of PC-3M-luc-C6trpv6+/+ cells treated with either 6 µg/mL ulocuplumab or mAb82 or mAbAU1, as a control, for 4 days. t Annexin V-FITC and IP analysis and quantification via flow cytometry of PC-3M-luc-C6trpv6+/+ cells treated with either 6 µg/mL ulocuplumab or mAb82 or mAbAU1, as a control, for 3 days. u Representative images and quantification of TRPV6/CXCR4 complexes revealed via the PLA in PC-3M-luc-C6trpv6+/+ cells treated with either 6 µg/mL mAb82 together with 30 mM AMD3100 for 36 h. Scale bar, 10 µm. Mean ± SEM (o, q– t). Two-sided t test (d, k). Two-way ANOVA (o, q–u). Log rank (Mantel‒Cox) test (b, e, h, k). See also Supplementary Fig. 7

References

    1. Gerstberger, S., Jiang, Q. & Ganesh, K. Metastasis. Cell186, 1564–1579 (2023). - PMC - PubMed
    1. Lambert, A. W., Pattabiraman, D. R. & Weinberg, R. A. Emerging biological principles of metastasis. Cell168, 670–691 (2017). - PMC - PubMed
    1. Coleman, R. E. et al. Bone metastases. Nat. Rev. Dis. Prim.6, 83 (2020). - PubMed
    1. Akhtar, M., Haider, A., Rashid, S. & Al-Nabet, A. D. M. H. Paget’s ‘seed and soil’ theory of cancer metastasis: an idea whose time has come. Adv. Anat. Pathol.26, 69–74 (2019). - PubMed
    1. Paget, S. The distribution of secondary growths in cancer of the breast. Lancet133, 571–573 (1889). - PubMed

MeSH terms