. 2025 Sep 2:3:IMAG.a.128.
doi: 10.1162/IMAG.a.128. eCollection 2025.

Functional ultrasound (fUS) detects mild cerebral alterations using canonical correlation analysis denoising and dynamic functional connectivity analysis

Affiliations

Functional ultrasound (fUS) detects mild cerebral alterations using canonical correlation analysis denoising and dynamic functional connectivity analysis

Flora Faure et al. Imaging Neurosci (Camb). .

Abstract

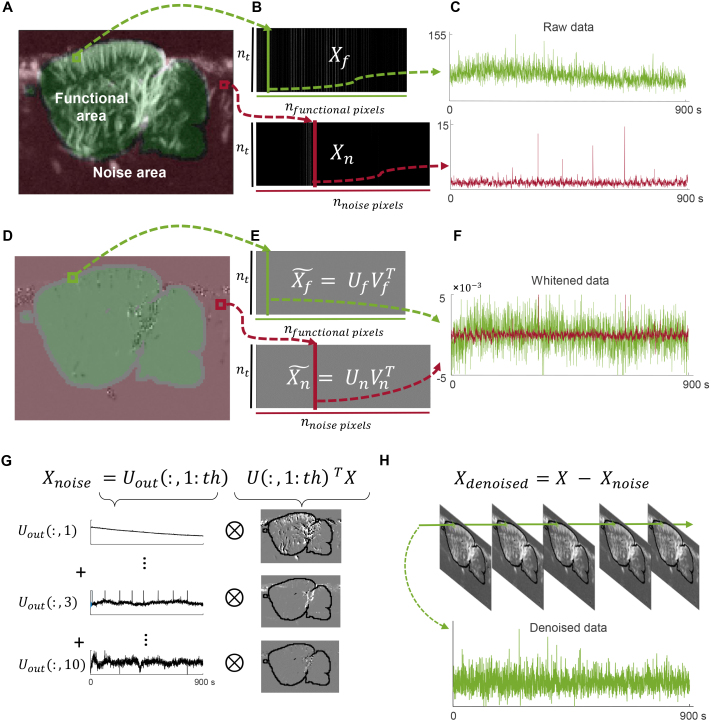
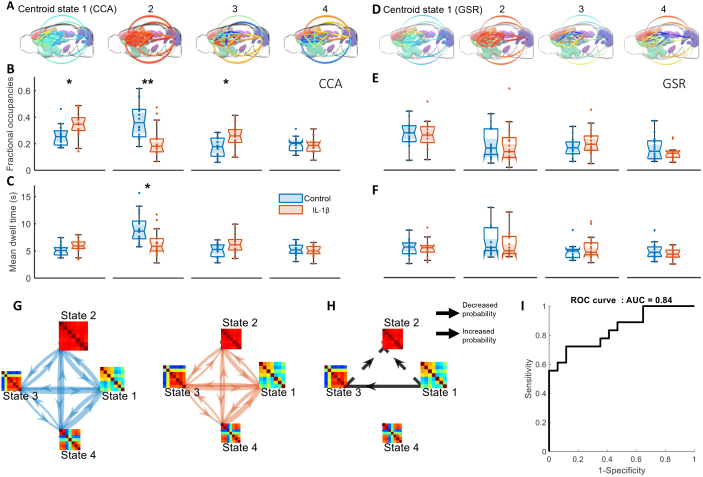
Functional ultrasound (fUS) is a promising imaging method for evaluating brain function in animals and human neonates. fUS images local cerebral blood volume changes to map brain activity. One application of fUS imaging is the quantification of functional connectivity (FC), which characterizes the strength of the connections between functionally connected brain areas. fUS-FC enables characterization of important cerebral alterations in pathological animal models, with potential for translation into identification of biomarkers of neurodevelopmental disorders. However, the sensitivity of fUS to signal sources other than cerebral activity, such as motion artifacts, cardiac pulsatility, anesthesia (if present), and respiration, limits its capacity to distinguish milder cerebral alterations. Here, we show that using canonical correlation analysis (CCA) preprocessing and dynamic functional connectivity analysis, we can efficiently decouple noise signals from the fUS-FC signal. We use this method to characterize the effects of a mild perinatal inflammation on FC in mice. The inflammation mouse model showed lower occurrence of states of high FC between the cortex, hippocampus, thalamus, and cerebellum as compared with controls, while connectivity states limited either to intracortical connections or to ventral pathways were more often observed in the inflammation model. These important differences could not be distinguished using other preprocessing techniques that we compared, such as global signal regression, highlighting the advantage of canonical correlation analysis for preprocessing fUS data. CCA preprocessing is applicable to a wide variety of fUS imaging experimental situations, from anesthetized to awake animal studies, or for neonatal, perinatal, or neurodevelopmental imaging. Beyond fUS imaging, this method can also be applied to FC data from any neuroimaging modality when the sources of noise can be spatially identified.

Keywords: canonical correlation analysis denoising; dynamic functional connectivity; functional ultrasound imaging; neuroinflammation; perinatal systemic inflammation.


Conflict of interest statement

The authors have no competing interests to declare.

Figures

Fig. 1.
Fig. 1.
Protocol for assessment of changes in long-term functional connectivity using functional ultrasound imaging in a mouse model of IL-1β systemic perinatal inflammation. (A) Induction of the perinatal systemic inflammation model. Intra-peritoneal injection of Interleukin-1-beta (IL-1β) was performed between P2 and P5, twice per day. The control group received injection of saline (PBS). (B) Effects of the systemic perinatal inflammation include hypomyelination, a slight decrease of cerebral volume and impact on specific cell populations. (C) fUS imaging protocol at P30. Animal preparation (first row) includes ketamine–xylazine anesthesia, holding in a stereotaxic frame, craniotomy, and positioning. fUS imaging (second row) includes whole brain vascular imaging, then a 3D scan for functional atlas registration and selection of the acquisition plane that includes the functional areas of interest. Fifteen minutes of resting-state fUS imaging is then acquired at the selected parasagittal plane of interest.
Fig. 2.
Fig. 2.
Canonical correlation analysis (CCA) denoising steps. (A) Spatial definition of two datasets: delimitation of the brain functional region of interest (ROI) (green) and the noise ROI (red) on the average fUS image. (B) Functional data and noisy data are arranged in two matrices Xf and Xn whose dimensions are number of time points x number of pixels (C). One column of those matrices is, therefore, the fUS signal time course in one pixel. (D) Data whitening. Effect of the data whitening of the spatial image (removal of relative amplitude information). (E) The whitened matrices X˜f and X˜n are used in the second step of the CCA (concatenation before singular value decomposition). (F) Pixel time courses after data whitening. (G) Projection on the common noise basis and threshold selection to determine the noisy signal to remove from the functional signal (green pixels). X is the concatenation of both datasets [Xf Xn], U is the component of SVD decomposition of the concatenated whitened data [X˜f X˜n]=USVT. (H) Denoising of the signal. The noise is removed from the original data in every pixel. Time course of the denoised signal of the selected functional pixel from functional area.
Fig. 3.
Fig. 3.
Synchronicity matrices construction. (A) Power Doppler image of the selected sagittal plane with delimitation of regions of interest (ROI) overlaid. (B) Computation of synchronicity matrices. Within ROIs (here the motor areas in blue and the striatum in orange), the phase signal is extracted using a Hilbert transformation of the ROI-averaged CBV signal. For each time point, a synchronicity matrix is calculated by computing the cosine of the phase difference between the two ROI-averaged CBV signal. (C) Two examples of synchronicity matrices are shown at times t1 and t2.
Fig. 4.
Fig. 4.
Canonical correlation analysis (CCA) denoising effects. (A) Threshold determination: Correlation between the averaged absolute tissue motion and the averaged denoised signal for varying denoising threshold values is plotted. Each colored line represents data from an individual mouse. The black line represents the mean correlation value across all mice. (B, C) CCA denoising modifies the correlation between pixels. Correlation matrices between pixels from functional and noise areas before CCA denoising (B) and after CCA denoising (C) are shown for a given mouse. (HPC = Hippocampus; TH = Thalamus; Str = Striatum; Ins = Agranular Insula; M1 = Motor cortex; S1 = Somatosensory cortex; CC = cerebellar cortex.). Green boxes highlight the “functional-to-functional” sub-matrix, red boxes highlight the “noise-to-noise” submatrix, with the functional-to-noise (symmetrical) sub-matrix being the upper right corner of the matrix. (D, E) CCA reduces the global level of correlation without concealing relevant functional connectivity, such as inter-hemispheric connectivity. (D) Seed-based correlation maps for a control mouse with a hippocampus seed (top) and an agranular insula seed (bottom) before (left) and after (right) CCA denoising. (E) Seed-based correlation maps for a control mouse presenting a high level of correlated noise with a hippocampus seed (top) and a cortical seed (bottom) before (left) and after (right) CCA denoising.
Fig. 5.
Fig. 5.
(A) Centroid states resulting from the K-means algorithm for K = 4. States are sorted by increasing total occurrences. Below each matrix, a 3D representation of the brain state, with links representing the corresponding coefficients of the matrix. The same colormap is used for matrix and 3D representations. (B) Representation of the clustered synchronicity matrices for one animal. Individual synchronicity matrices are represented by points in a 3D space whose basis is the first three principal components of the principal component analysis performed on all matrices. Each color shows the corresponding affiliation to cluster determined by the K-means algorithm. (C) Validation of states robustness with leave-one-out cross-validation (LOOCV). States are represented in a 3D graph so that the edges (black lines) are proportional to the L1-norm distances between the matrices. At each node, the radius of the red sphere is the averaged distance between the states found with N mice and the states found with N-1 mice at each iteration of the LOOCV. (D) Validation of states classification. At each LOOCV iteration, we compute a classification score for the left-out animals as the number of time points correctly classified divided by the total number of time points. The histogram shows the percentage of animals within each band score.
Fig. 6.
Fig. 6.
IL-1β mice have a different pattern of dynamic functional connectivity (dFC), as revealed by CCA preprocessing. (A) Brain states after CCA denoising. 3D representation of the brain state as introduced in Figure 5, when using CCA denoising as a preprocessing. (B) Fractional occupancies (CCA denoising). Two-way t-tests were performed between the control group (blue) and the IL-1β group (orange) for each centroid state, followed by Bonferroni correction for multiple comparisons with a degree of freedom equal to the number of states –1 (i.e., 3) (*p < 0.05, **p < 0.01, ***p < 0.001). (C) Mean dwell times (CCA denoising). Mann–Whitney U test was performed between the control group (blue) and the IL-1β group (orange) for each centroid state, followed by Bonferroni correction for multiple comparisons with a degree of freedom equal to the number of states (i.e., 4) (*p < 0.05, **p < 0.01, ***p < 0.001). (D) Brain states after global signal regression (GSR) preprocessing. 3D representation of the brain state when using GSR as a preprocessing. (E) Fractional occupancies (GSR). Two-way t-test analysis was performed between the control group (blue) and the IL-1β group (orange) for each centroid state, followed by Bonferroni correction for multiple comparisons, showing no significant differences across states. (F) Mean dwell times (GSR). Mann–Whitney U test was performed between the control group (blue) and the IL-1β group (orange) for each centroid state, followed by Bonferroni correction, showing no significant differences across states. (G) State transitions for the control group (blue arrows) and the IL-1β group (orange arrows) after CCA denoising. The width of the arrows is proportional to the probability of transition from one state to another. The size of the matrices is proportional to their fractional occupancies. (H) Significant differences in state transition (CCA denoising). Two-way t-test was performed followed by Bonferroni correction for multiple comparisons with a degree of freedom equal to the number of transitions (i.e., 12). Dashed arrows represent a significantly decreased probability of transition, and the full arrow a significantly increased probability of transition (p < 0.05). (I) Classification evaluation performance of dFC biomarkers (CCA denoising). Receiving operator characteristics (ROC) curve obtained for the logistic regression model of the following dFC biomarkers: Fractional occupancies of states 1, 2, and 3 and mean dwell time of state 2. AUC = area under the curve.

Similar articles

References

    1. Agut, T., Alarcon, A., Cabañas, F., Bartocci, M., Martinez-Biarge, M., Horsch, S., Agut, T., Alarcon, A., Arena, R., Bartocci, M., Bravo, M., Cabañas, F., Carreras, N., Claris, O., Dudink, J., Fumagalli, M., Govaert, P., Horsch, S., Parodi, A., … Valverde, E. (2020). Preterm white matter injury: Ultrasound diagnosis and classification. Pediatric Research, 87, 37–49. 10.1038/s41390-020-0781-1 - DOI - PMC - PubMed
    1. Ayata, C., & Lauritzen, M. (2015). Spreading depression, spreading depolarizations, and the cerebral vasculature. Physiological Reviews, 95(3), 953–993. 10.1152/physrev.00027.2014 - DOI - PMC - PubMed
    1. Aydin, A. K., Haselden, W. D., Goulam Houssen, Y., Pouzat, C., Rungta, R. L., Demené, C., Tanter, M., Drew, P. J., Charpak, S., & Boido, D. (2020). Transfer functions linking neural calcium to single voxel functional ultrasound signal. Nature Communications, 11(1), 1–10. 10.1038/s41467-020-16774-9 - DOI - PMC - PubMed
    1. Baranger, J., Arnal, B., Perren, F., Baud, O., Tanter, M., & Demene, C. (2018). Adaptive spatiotemporal SVD clutter filtering for ultrafast Doppler imaging using similarity of spatial singular vectors. IEEE Transactions on Medical Imaging, 37(7), 1574–1586. 10.1109/TMI.2018.2789499 - DOI - PubMed
    1. Baranger, J., Demene, C., Frerot, A., Faure, F., Delanoë, C., Serroune, H., Houdouin, A., Mairesse, J., Biran, V., Baud, O., & Tanter, M. (2021). Bedside functional monitoring of the dynamic brain connectivity in human neonates. Nature Communications, 12(1), 1080. 10.1038/s41467-021-21387-x - DOI - PMC - PubMed

LinkOut - more resources