[Preprint]. 2025 Aug 27:2025.08.26.671106.
doi: 10.1101/2025.08.26.671106.

An Efficient Lasso Framework for Admixture-Aware Polygenic Scores

Affiliations

An Efficient Lasso Framework for Admixture-Aware Polygenic Scores

Franklin Ockerman et al. bioRxiv. .

Abstract

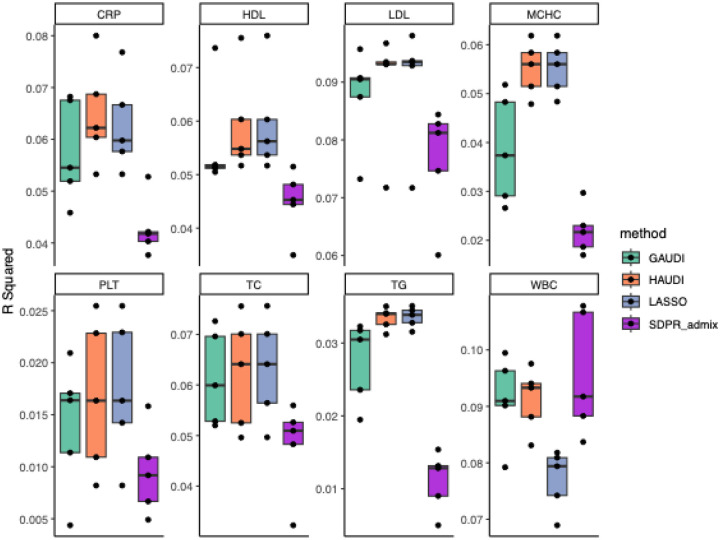
Polygenic scores (PGS) have promising clinical applications for risk stratification, disease screening, and personalized medicine. However, most PGS are trained on predominantly European ancestry cohorts and have limited portability to external populations. While cross-population PGS methods have demonstrated greater generalizability than single-ancestry PGS, they fail to properly account for individuals with recent admixture between continental ancestry groups. GAUDI is a recently proposed PGS method which overcomes this gap by leveraging local ancestry to estimate ancestry-specific effects, penalizing but allowing ancestry-differential effects. However, the modified fused LASSO approach used by GAUDI is computationally expensive and does not readily accommodate more than two-way admixture. To address these limitations, we introduce HAUDI, an efficient LASSO framework for admixed PGS construction. HAUDI re-parameterizes the GAUDI model as a standard LASSO problem, allowing for extension to multi-way admixture settings and far superior computational speed than GAUDI. In extensive simulations, HAUDI compares favorably to GAUDI while dramatically reducing computation time. In real data applications, HAUDI uniformly out-performs GAUDI across 18 clinical phenotypes, including total triglycerides (TG), C-reactive protein (CRP), and mean corpuscular hemoglobin concentration (MCHC), and shows substantial benefits over an ancestry-agnostic PGS for white blood cell count (WBC) and chronic kidney disease (CKD).


Figures

Fig 1:
Fig 1:. Schematic overview of a HAUDI.
In step 0, we define the phenotype model for an individual under the HAUDI framework. HAUDI requires individual-level phased genotype data (a). We assume an individual haplotype is a composition of segments inherited from two or more source populations, and in b), we define an indicator for local ancestry at each variant and haplotype. An individual’s genetic contribution to their phenotype c) is the sum of ancestry-specific effects across the genome. In step 1, we estimate local ancestry in a target dataset, using a reference panel of haplotypes from each source population. In step 2, we minimize HAUDI’s objective function and obtain a set of ancestry-specific effect estimates. We obtain a final PGS by applying these effects to the phenotype model defined in step 0.
Fig 2:
Fig 2:. Comparison of PGS methods under various simulation settings.
Box-plots correspond to R2 value across 10 test sets. Simulation settings include genetic correlation (ρg) between CEU/YRI-specific effects, heritability, and number of true causal variants. All models were fit on 1000 total variants, including causal variants.
Fig 3:
Fig 3:. Comparisons between estimated and true CEU-specific effects.
Plotted in each panel are the estimated (x axis) and true (y axis) variant effects, stratified by genetic correlation and PGS method. Only the first repetition is plotted for illustration, however the correlation between the true and estimated effects across all simulations (r) is annotated for each panel. This figure is restricted to CEU-specific effects. For LASSO, the x-axis shows estimated ancestry-agnostic effects.
Fig 4:
Fig 4:. Comparison of test set R2 on PAGE African American data.
Penalized regression models (GAUDI, HAUDI, LASSO) were fit using the top 500 pruned variants by p-value in UKB GWAS data. SDPR_admix was fit using the top 50,000 pruned variants. Phenotypes are restricted to those with N > 5000 and mean R2 > 0.01 in at least one model. Per-phenotype boxplots correspond to the R2 values in each test set fold.
Fig 5:
Fig 5:. Comparison of PGS run time on data from PAGE African American participants.
We report run times across phenotypes and testing folds for the three admixed PGS models. To compare SDPR_admix and HAUDI (a), we restrict to models fit on 50,000 variants. To compare GAUDI and HAUDI, we restrict to models with 500 variants.
Fig 6:
Fig 6:. Comparison of GAUDI and LASSO test set R2 on PAGE Hispanic/Latino data.
All models were fit using the top 500, 10000, or 50000 variants (by p-value in UKB GWAS data). Phenotypes are restricted to those with N > 5000 and mean R2 > 0.01 in at least one model. Per-phenotype boxplots correspond to the R2 values in each test set fold.
Fig 7:
Fig 7:. Comparison of HAUDI ancestry-specific effect estimates (African-American participants).
Effect estimates were obtained using the optimal set of tuning parameters (selected by cross-validation) in the first training fold. HDL (b) was chosen as a comparator for WBC (a) to demonstrate that HAUDI can also capture genetic architectures with similar effects across ancestries. Correlation between ancestry-specific effects (r) is given in each panel.
Fig 8:
Fig 8:. Comparison of HAUDI ancestry-specific effect estimates (Hispanic/Latino samples) for White Blood Cell Count (WBC).
Effect estimates were obtained using the optimal set of tuning parameters (selected by cross-validation) in the first training fold. HDL (b) was chosen as a comparator for WBC (a) to demonstrate that HAUDI can also capture genetic architectures with similar effects across ancestries. Correlation between ancestry-specific effects (r) is given in each panel.

References

    1. Wray N. R. et al. From Basic Science to Clinical Application of Polygenic Risk Scores: A Primer. JAMA Psychiatry 78, 101–109 (2021). - PubMed
    1. Lu X. et al. A polygenic risk score improves risk stratification of coronary artery disease: a large-scale prospective Chinese cohort study. Eur. Heart J. 43, 1702–1711 (2022). - PMC - PubMed
    1. Seibert T. M. et al. Polygenic hazard score to guide screening for aggressive prostate cancer: development and validation in large scale cohorts. BMJ 360, j5757 (2018). - PMC - PubMed
    1. Khera A. V. et al. Genome-wide polygenic scores for common diseases identify individuals with risk equivalent to monogenic mutations. Nat. Genet. 50, 1219–1224 (2018). - PMC - PubMed
    1. Torkamani A., Wineinger N. E. & Topol E. J. The personal and clinical utility of polygenic risk scores. Nat. Rev. Genet. 19, 581–590 (2018). - PubMed

Publication types

LinkOut - more resources