[Preprint]. 2025 Aug 25:2025.08.25.671815.
doi: 10.1101/2025.08.25.671815.

Connectomics Reveals a Feed-Forward Swallowing Circuit Driving Protein Appetite

Affiliations

Connectomics Reveals a Feed-Forward Swallowing Circuit Driving Protein Appetite

I Tastekin et al. bioRxiv. .

Abstract

Nutrient state shapes not only what animals eat, but how they eat it. In Drosophila, protein deprivation prolongs protein-specific feeding bursts, yet the motor mechanism underlying this change remains unknown. Using EM connectomics, we identified a feed-forward pathway from protein-sensitive gustatory receptor neurons to swallowing motor neurons. At its core is the Sustain neuron, which coordinates multiple swallowing motor neurons to move food efficiently through the cibarium and pharynx. This nutrient-dependent facilitation of swallowing sustains long feeding bursts, directly linking internal state to the temporal structure of feeding. Our findings reveal how a dedicated sensorimotor circuit translates physiological need into precise motor control to drive nutrient specific feeding appetite.


Figures

Figure 1 ∣
Figure 1 ∣. The feeding microstructure and its modulation by yeast deprivation via IR76b-expressing GRNs
a, schematic representation of the proboscis positions during feeding. Retracted (top panel) and extended (bottom panel) positions are depicted. b, the feeding microstructure of Drosophila melanogaster. An extension-ingestion-retraction cycle of proboscis is called a ‘sip’. Sips are organized into feeding bursts with stereotpyical sip durations and inter-sip intervals. Multiple feeding bursts form an activity bout (Itskov et. al 2014). c, Taste organs of the proboscis. Hair-like bristle sensilla (cyan) are found on the outer surface of the labellum, and taste peg sensilla (green) reside in the inner surface of the labellum. Three pharyngeal sense organs (light orange) are found along the pharynx located within the proboscis. d, the projections of IR76b expressing gustatory receptor neurons (GRNs) in the subesophageal zone (SEZ) of the fly brain. Different sensillar projections are color coded as in c. e, the effect of silencing IR76b expressing neurons on yeast feeding. To silence IR76b neurons, the inward rectifying potassium channel Kir2.1 was expressed under the control of IR76b-Gal4 in yeast-deprived flies. Silencing IR76b neurons led to a drastic decrease in total number of sips (left), the length of feeding bursts (middle) and an increase in the duration of inter-burst intervals (right) when compared to the UAS control: w1118 x UAS-Kir2.1, tubGal80ts, and the Gal4 control: IR76b-Gal4 > w1118. f and g, the effect of silencing taste peg GRNs using R57F03-Gal4 which labels taste peg neurons on yeast feeding in f, yeast deprived, and g, full-fed flies. Inter-burst intervals were not affected (right panels). The length of feeding bursts is affected upon silencing f, in yeast deprived but g, not in fully fed flies (left panels). e-g, the conditional expression of Kir2.1 was controlled using a ubiquitously expressed temperature-sensitive Gal80 (tubulin-Gal80ts). The flies were moved to 30° Celcius one day before the experiment to switch on the expression of Kir2.1. Filled circles indicate individual flies. Boxes indicate the interquartile ranges. Horizontal lines indicate the median value. ns: not statistically significant, Wilcoxon ranksum test. p values are indicated. ***: p<0.001
Figure 2 ∣
Figure 2 ∣. FlyWire dataset reveals that taste peg GRNs comprise two morphologically distinct subtypes
a, the taste peg gustatory receptor neuron (tpGRN) projections (green) in the electron microscopy volume, FAFB – FlyWire. The brain neuropile is shown as a semi-transparent mesh (anterior view). Numbers in brackets indicate the number of identified tpGRNs on each side of the brain. b, close-up view of tpGRN projections in the gnathal ganglia (GNG) of the SEZ. Anterior (left) and lateral (right) views are shown. The GNG is shown as a semi-transparent mesh. c and d, hierarchical morphological clustering of taste peg GRNs based on computed NBLAST scores. c, left and d, right hemisphere. In both hemispheres two main clusters were identified: dtpGRNs: dorsal tpGRNs (blue), ctpGRNs: claw tpGRNs (magenta). A third cluster was termed incomplete: it contains tpGRNs of which proofreading could not be completed due to technical reasons (pink). e, morphology of dtpGRNs (blue, anterior view). arrows indicate the characteristic dorsal loop of these neurons. ctpGRNs are plotted in light grey. f, morphology of ctpGRNs (magenta, anterior view). arrows indicate the claw-like lateral projections of these neurons. dtpGRNs are plotted in light grey.
Figure 3 ∣
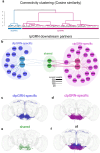
Figure 3 ∣. Taste peg GRNs are clustered into two groups based on their downstream connectivity
a, hierarchical clustering of tpGRNs using pairwise cosine similarity scores based on downstream connectivity. dtpGRNs (blue) and ctpGRNs (magenta) form two distinct clusters independently of the side to which they project. L: tpGRN with a left-hemisphere projection, R: tpGRN with a right hemisphere projection. b, tpGRN downstream connectivity. The Yifan Hu’s proportional network layout method is used to plot the downstream network from dtpGRNs (light blue circles) and ctpGRNs (light magenta). dtpGRN-specific (dark blue), ctpGRN-specific (light purple) and shared (green) downstream neuronal cell types with more than 19 synapses with either tpGRN type on each hemisphere are shown. Thickness of the arrows are proportional to the synaptic weight between cell types. FlyWire cell type of each node is indicated. c-f, morphological representation of downstream neurons in FAFB – FlyWire. c, dtpGRN-specific downstream partners, d, ctpGRN-specific downstream partners, e, shared downstream partners and f, overlay of all types. Anterior view. Brain neuropile is shown as a semi-transparent mesh.
Figure 4 ∣
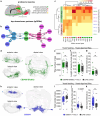
Figure 4 ∣. Effective connectivity analysis reveals two hubs of tpGRN downstream neurons with distinct connectivity to proboscis motor neurons
a, proboscis muscle groups responsible for the movement of the proboscis during proboscis extension-retraction (labellum, haustellum and rostrum) and ingestion (pharyngeal pumping and salivary gland). Muscle groups are color coded according to their function. b, top downstream partners of dtpGRNs and ctpGRNs. Criteria for selecting top partners are explained in the main text. Proportional synaptic strengths from tpGRNs to downstream partners are shown as numbers on the arrows. Thickness of the arrows are proportional to the synaptic weight between cell types. L: left, R: right. c, heatmap and hierarchical clustering of top tpGRN downstream partners using effective connectivity scores with different motor neuron types. Motor neurons are color coded according to their function. Top tpGRN downstream partners are color coded according to their tpGRN connectivity (blue: dtpGRN-specific, magenta: ctpGRN-specific, and green: shared). Hierarchical clustering reveals two downstream hubs: A PER hub (color) and a Swallow hub (color). d, morphological representation of CB0499 (also known as Rattle) from different points of view. The GNG is shown as a semi-transparent mesh. e-g, silencing CB0499, which is in the PER hub, using Kir2.1 does not influence the feeding microstructure parameters for yeast feeding in yeast-deprived flies. h, morphological representation of the dtpGRN-specific downstream partner CB0041 from different points of view. The GNG is shown as a semi-transparent mesh. i-k, silencing the Swallow Hub downstream neuron CB0041 in yeast-deprived flies leads to an almost statistically significant increase in length of yeast feeding bursts (middle panel, p value is indicated). Filled circles indicate individual flies. Boxes indicate the interquartile ranges. Horizontal lines indicate the median value. UAS control: Empty Split-Gal4 x UAS-Kir2.1. ns: not statistically significant, Wilcoxon ranksum test.
Figure 5 ∣
Figure 5 ∣. A third-order neuron CB0302 downstream dorsal tpGRNs is important for regulating the length of yeast feeding bursts in a protein state-dependent way.
a, connectivity diagram between dtpGRN second-order neuron CB0041 and third-order neuron CB0302. L: left hemisphere, R: right hemisphere. Absolute synaptic weights are shown as numbers besides the arrowheads. b, morphological representation of CB0302 in the EM volume, FAFB – FlyWire. Different points of view are shown. The GNG is shown as a semi-transparent mesh. c, morphological comparison of a CB0302 EM instance (left) with a multi-color-flip-out (MCFO) clone (right) obtained using a specific Split-Gal4 driver line generated to access CB0302. d, yeast-deprived, CB0302-silenced flies have shorter yeast feeding bursts compared to the genetic control (middle panel). They have higher total number of sips (left panel), but the inter-burst intervals are not affected (right panel). e, fully-fed, CB0302-silenced flies show no difference in the total number of yeast sips, length of yeast feeding bursts and inter-sip intervals when compared to the genetic control. f and g, feeding microstructure parameters underlying sucrose feeding are not affected by CB0302 silencing in either fully-fed or carbohydrate-deprived flies. Filled circles indicate individual flies. Boxes indicate the interquartile ranges. Horizontal lines indicate the median value. UAS control: Empty Split-Gal4 x UAS-Kir2.1. ns: not statistically significant, Wilcoxon ranksum test. **: 0.001< p <0.01, ***: p<0.001.
Figure 6 ∣
Figure 6 ∣. Sustain controls pharyngeal motor neuron MN11D, which is necessary for modulating the length of feeding bursts independent of the nutrient quality.
a, effective connectivity scores between Sustain (CB0302) and proboscis motor neurons. Motor neuron types are color-coded based on their function and sorted according to effective connectivity. b, Sustain is connected to MN11D through fourth order neurons, CB0910 and CB0459. L: left hemisphere, R: right hemisphere. c, morphological representation of MN11D (CB0700) in the EM volume, FAFB – FlyWire. Different points of view are shown. The GNG is shown as a semi-transparent mesh. d, expression pattern of the Split-Gal4 driver line labeling MN11D in the brain (maximum intensity projection). Neuropile: magenta, MN11D > mCD8::GFP: green. e and f, silencing MN11D leads to a decrease in the length of the feeding bursts for both yeast and sucrose feeding (middle panels) while total number of sips and inter-burst intervals remain unaffected (left and right panels). Filled circles indicate individual flies. Boxes indicate the interquartile ranges. Horizontal lines indicate the median value. UAS control: Empty Split-Gal4 x UAS-Kir2.1. ns: not statistically significant, Wilcoxon ranksum test. **: 0.001< p <0.01, ***: p<0.001.
Figure 7 ∣
Figure 7 ∣. Pharyngeal pumping assay reveals that Sustain modulates the ingestion volume to prolong feeding bursts.
a, snapshots of a movie in which a fly was recorded feeding from a capillary filled with artificially colored food (10% yeast with erioglaucine). DeepLabCut was used to track the capillary tip and different points (labels) on the fly to quantify ingestion automatically. The labels are color-coded and annotated on the right side of the panel. Before feeding starts (t= −1.3 s), the proboscis rests in a retracted position. Upon proboscis extension, the proboscis contacts the food droplet, and the labial palps spread to initiate ingestion (t =0 s, feeding initiation). The fly fills its cibarium (pharyngeal cavity of the fly) with a small amount of food (t = 0.116 s). Finally flies empties the cibarium and ingests the food droplet by pumping it through its esophagus (t = 0.223 s). b, the labial opening angle is used to identify the initiation of a pumping burst. At rest, the labial angle is small (angle a, t = −1.3 s). Upon contacting the food droplet (t= 0 s), the labial palps spread leading to an increased labial angle (angle b). c, four points enclosing the cibarium are tracked to calculate the cibarial area. Inter-bristle distances for each fly are used to normalize for the size variation between flies. d, changes in the labial opening angle are used to detect pumping bursts (top panel). A representative time series of normalized cibarial areas (in pixels) during a pumping burst is shown (bottom panel). Red dots represent the peak cibarial area for each swallowing cycle. e and f, sustain silencing leads to a decrease in the ingestion volume as quantified by normalized peak cibarial area. e, kernel density estimations of normalized peak cibarial areas for Sustain-silenced and control flies. f, mean normalized peak cibarial area for individual Sustain-silenced and control flies. Boxes indicate the interquartile ranges. Horizontal lines indicate the median value. Notches indicate 95% confidence intervals. g, power-spectral density of ingestion frequencies for Sustain-silenced and control flies. Dotted vertical lines represent the peak frequencies. UAS control: Empty Split-Gal4 x UAS-Kir2.1. ns: not statistically significant. *: p<0.05. h and i, the working model. h, the modulation of the dtpGRNs pathway by the protein state increases the efficiency of ingestion by anticipatorily activating MN11D before the food arrives in the pharynx, thereby delaying the inhibition of sip generation. i, the feeding microstructure revisited. Ingestion is incorporated into the model. Vertical bars indicated the sipping (green) and ingestion (light pink) actions. The length of the ingestion bars is scaled by efficiency. Ingestion is more efficient, therefore, feeding bursts are longer in amino acid-deprived flies.

References

    1. Le Couteur D. G. et al. The impact of low-protein high-carbohydrate diets on aging and lifespan. Cell. Mol. Life Sci. 73, 1237–1252 (2016). - PMC - PubMed
    1. Solon-Biet S. M. et al. Macronutrient balance, reproductive function, and lifespan in aging mice. Proceedings of the National Academy of Sciences 112, 3481–3486 (2015). - PMC - PubMed
    1. Panda A. & Booth S. L. Nutritional Aspects of Healthy Aging. Med Clin North Am 106, 853–863 (2022). - PubMed
    1. Berthoud H.-R. Neural control of appetite: cross-talk between homeostatic and non-homeostatic systems. Appetite 43, 315–317 (2004). - PubMed
    1. Andermann M. L. & Lowell B. B. Toward a Wiring Diagram Understanding of Appetite Control. Neuron 95, 757–778 (2017). - PMC - PubMed

Publication types

LinkOut - more resources