[Preprint]. 2025 Aug 28:2025.08.23.671940.
doi: 10.1101/2025.08.23.671940.

Restraint of TGFβ family signaling by SMAD7 is necessary for hematopoietic stem cell maturation in the embryo

Affiliations

Restraint of TGFβ family signaling by SMAD7 is necessary for hematopoietic stem cell maturation in the embryo

Laura F Bennett et al. bioRxiv. .

Abstract

Hematopoietic stem cells (HSCs), defined as cells that can engraft an adult when transplanted, mature from precursors (pre-HSCs) that differentiate from hemogenic endothelial cells (HECs) in the embryo. Many signaling pathways required to generate the first hematopoietic stem and progenitor cells in the embryo are well-characterized, but how HSCs mature from pre-HSCs is poorly understood. Here we show that "mothers against decapentaplegic homolog 7" (SMAD7), a negative regulator of transforming growth factor beta (TGFβ) and bone morphogenetic protein (BMP) signaling, is required for pre-HSC to HSC maturation. Deletion of Smad7 in endothelial cells allows the formation of pre-HSCs from HECs but impairs their maturation into HSCs. The data indicate that although TGFβ and BMP signaling are required for the generation of HECs and for HECs to undergo an endothelial-to-hematopoietic transition to generate pre-HSCs, one or both pathways must be subsequently down-regulated for effective pre-HSC to HSC maturation.

Keywords: SMAD7; TGFβ signaling; hematopoietic stem cells; pre-HSCs.


Figures

Figure 1.
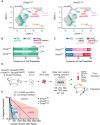
Figure 1.. Loss of SMAD7 does not impact IAHC formation but severely reduces the number of adult multi-lineage repopulating HSCs in the caudal arteries.
(A) Representative confocal Z-projections of E10.5 Smad7f/f and Smad7Δ/Δ embryos (head, intestines, and body wall removed) stained for CD31 (red). Scale bar=250μM. (B) The width of the dorsal aorta (μM) in E10.5 embryos was assessed by taking 5 measurements over 6 sp centered around the vitelline artery. Mean±SD, unpaired, two-tailed Student’s t-test, n=3 embryos per genotype, 29-35 somite pairs (sp). (C) Representative confocal images of IAHC cells (indicated by white arrowheads) in the dorsal aorta of E10.5 embryos stained for CD31 (red) and RUNX (green). Scale bar=100μM, n=4-5 embryos. (D) Quantification of HECs per mm in E10.5 dorsal aortas. Mean±SD, unpaired, two-tailed Student’s t-test. n=4-5 embryos, 29-35 sp. (E) Quantification of IAHC cells in E10.5 dorsal aortas. Mean±SD, unpaired, two-tailed Student’s t-test, n=4-5 embryos. (F,G) Corrected fluorescent intensity of RUNX1 measured from confocal images in HECs (F) or IAHC cells (G) of E10.5 embryos. Mean±SD, unpaired, two-tailed Student’s t-test. n=352 Smad7f/f HECs, 532 Smad7Δ/Δ HECs, 364 Smad7f/f IAHC cells, 425 Smad7Δ/Δ IAHC cells from 3-4 embryos per genotype. (H) Percent donor-derived CD45+ cells in PB of myelo-ablated adult recipient mice 16 weeks after transplanting one embryo equivalent (ee) of E11.5 A+U+V from Smad7 f/f, Smad7Δ/Δ, or Smad7+/+; Cdh5-CreERT embryos. Each dot represents one recipient. One-way ANOVA, Tukey’s test for multiple correction comparison, n=7-14 recipients. (I) Limiting dilution analysis of adult-repopulating HSCs in the A+U+V of E12.5 Smad7f/f and Smad7Δ/Δ embryos. Shaded regions indicate 95% confidence intervals. HSC frequencies and significant differences in frequencies were determined by ELDA. Data are from 12-21 transplant recipients per cell dose per genotype. Data are plotted as the percentage of recipients at each dose with no donor engraftment. (J) Fraction of engrafted recipients at all doses of donor cells with multi-lineage versus lymphoid-only donor cell contribution. Multi-lineage engraftment is defined as >1% donor contribution to B, T, and myeloid lineages in the PB. Lymphoid-only engraftment refers to recipients with >1% B and/or T chimerism and <1% donor chimerism in myeloid cells in the PB. Fisher’s exact test, two-sided, 95% confidence interval, n=19-27 recipients per genotype. (K) Limiting dilution analysis of adult-repopulating HSCs in the FL of E12.5 Smad7f/f and Smad7Δ/Δ embryos. (L) Percentage of allelic deletion in donor-derived LSK cells sorted from the BM of mice transplanted with E12.5 Smad7f/f and Smad7Δ/Δ FL cells 16 weeks post-transplant. Donor-derived LSK cells were plated in methylcellulose, and individual colonies were genotyped by PCR. n=17-30 individual colonies. For all panels, *p ≤ 0.05, **p ≤ 0.01, ***p ≤ 0.001, ****p ≤ 0.0001.
Figure 2.
Figure 2.. SMAD7 is not required for generating normal numbers of HSC-independent HSPCs.
(A) Schematic diagram of the assay for determining the number of LMPs in the AGM regions of E10.5 Smad7f/f and Smad7Δ/Δ embryos. Cells from dissociated AGM regions were plated in limiting numbers on OP9 stromal cells, and wells were assessed 7-10 days later for the presence of B and myeloid cells. Cells were also plated in methylcellulose, and individual colonies were picked, and analyzed by PCR to quantify the efficiency of Smad7 deletion. (B) The number of progenitors per ee that produced B and/or myeloid cells in culture was determined by ELDA. All three colony types (B, B+myeloid, myeloid) are combined in each graph. n=4-5 embryos. (C) Deletion frequency of Smad7 alleles in myeloid colonies from methylcellulose colony assays. del/del, biallelic Smad7 deletion; f/del, monoallelic Smad7 deletion; f/f, no deletion of Smad7. n=3 embryos per genotype with 48 individual colonies analyzed per embryo. (D) Representative confocal Z projections of the developing thymus at E11.5 in Smad7f/f and Smad7Δ/Δ embryos stained for cytokeratin 8 (CK8) (red) and RUNX1 (green). Scale bar= 150 μM. Enlarged images of the insets (white boxes) are shown to the right of each panel. White arrowheads indicate RUNX1+ cells infiltrating or in contact with the thymus. (E) Quantification of RUNX1+ TSPs within or contacting the thymus, n=3-4 embryos. (F) Representative flow plots of c-Kit+CD45+Lin CD135+IL-7Rɑ+ LMPPs in E12.5 fetal livers. (G) Percent of LMPPs in Kit+CD45+Lin cells in E12.5 fetal livers of Smad7f/f and Smad7Δ/Δ embryos. n=5-8 embryos. In all panels mean ± SD, Student’s t-test, unpaired, two-tailed.
Figure 3.
Figure 3.. Loss of SMAD7 decreases the number of functional pre-HSCs.
(A) Schematic of pre-HSC maturation assay. IAHC cells were purified from the AGM region of E11.5 Smad7f/f and Smad7Δ/Δ embryos and plated in limiting numbers (125, 250, 500, 1000, and 2500 cells) on Akt-ECs and grown for 4 days. On day 4, half of the cells in each well were harvested for transplant and the other half was used for flow cytometry to identify phenotypic LT-HSCs. (B) Representative flow plots for the detection of phenotypic LT-HSCs in Akt-EC cultures. (C) Percentage of wells seeded with 250 IAHC cells that had evidence of hematopoietic cell growth defined as myeloid (Gr-1+ or F4/80+) or CD45+ cells by flow cytometry. (D) Percentage of wells seeded with 250 IAHC cells containing phenotypic LT-HSCs, defined as shown in panel B. (E) Quantification of LT-HSCs in pre-HSC maturation cultures determined by limiting dilution transplantation. Cells from each well were transplanted into CD45.1+ adult recipients (n=20-29 recipients with 3-8 recipients per dose for each genotype). The data represent 5 independent experiments. LT-HSC frequencies were calculated by ELDA.
Figure 4.
Figure 4.. SMAD7 promotes the maturation of pre-HSCs into HSCs.
(A) Uniform manifold approximation and projection (UMAP) plot of sorted CD31+CD44+CD41low/−c-Kitlow/+ cells from E11.5 Smad7f/f and Smad7Δ/Δ embryos projected onto the EHT trajectory from Zhu et al.. Populations shown include pre-HEC, (immediate cell precursor of HEC); HEC; EC (endothelial cells excluding HEC and pre-HEC); IAHC (pre-HSC) (pre-HSCs within the IAHC population); IAHC (other) (IAHC cells that are not pre-HSCs); FL-HSC (E14.5 FL LSK CD48CD150+ cells). (B) Distribution of cells between EC, HEC, and IAHC populations (including both pre-HSCs and other IAHC cells) in E11.5 Smad7f/f and Smad7Δ/Δ embryos. P values indicate significant differences in the distribution of cells in specific populations in Smad7f/f and Smad7Δ/Δ samples determined with the proportion test in R. (C) Distribution of cells with hematopoietic identity [HEC, IAHC (other), and IAHC (pre-HSC)] in E11.5 Smad7f/f and Smad7Δ/Δ embryos. (D) Schematic for deleting Smad7 ex vivo in pre-HSCs. IAHC cells from E11.5 Smad7 f/f, Smad7 f/f;Rosa26CreERT+, and Smad7f/+;Rosa26CreERT+ embryos were isolated and 4-OHT added when cells were plated on Akt-ECs. (E) Limiting dilution transplant from assay illustrated in panel D. n=15-28 recipients with 3-10 recipients per dose for each genotype. Data are from 3 independent experiments. HSC frequency calculated by ELDA.
Figure 5.
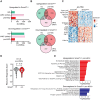
Figure 5.. Loss of SMAD7 causes cell type-specific alterations in gene expression.
(A) The total number of differentially expressed genes (DEGs) up- and down-regulated in E11.5 endothelial cells (ECs), IAHC (other) cells, and pre-HSCs. (B) Venn diagrams showing overlap of up- and down-regulated genes in Smad7Δ/Δ cells for EC, IAHC (other), and pre-HSC populations. (C) Top 25 DEGs up- and down-regulated in Smad7Δ/Δ pre-HSCs. (D) Ribosome biogenesis score for Smad7f/f and Smad7Δ/Δ pre-HSCs using the average expression level of the ribosome biogenesis program and calculating a score using AddModuleScore in Seurat. (E) Pathways enriched in genes up- and down-regulated in Smad7Δ/Δ pre-HSCs determined by Reactome analysis.
Figure 6.
Figure 6.. Smad7Δ/Δ LT-HSCs preferentially expand in the fetal liver and bone marrow.
(A) Quantification of phenotypic LT-HSCs (LSK CD48 CD150+) in FLs of E14.5 Smad7 f/f or Smad7Δ/Δ fetuses by flow cytometry. Mean±SD, unpaired, two-tailed Student’s t-test, n=8-21 FLs and 3 independent experiments. (B) Similar frequencies of functional LT-HSCs in Smad7f/f and Smad7Δ/Δ FLs as determined by limiting dilution analysis. 5K, 20K, 40K, 120K, or 400K unsorted Smad7f/f and Smad7Δ/Δ FL cells (CD45.2+) were transplanted into lethally irradiated recipients (CD45.1+). Shown are percent negative recipients at each dose where negative was defined as <1% donor chimerism in the PB at 16 weeks. n= 38-39 recipients per genotype with 5-15 recipients per dose. (C) Percentage of colonies with biallelic (del/del), monoallelic (f/del) or no Smad7 deletion (f/f) in E14.5 and E18.5 Smad7f/f and Smad7Δ/Δ FLs, and in donor-derived LT-HSCs in the BM 16 weeks post-transplant of E14.5 FL cells. LT-HSCs were sorted from the FL or BM, plated in methylcellulose, and individual colonies were genotyped by PCR. Mean±SD, two-way ANOVA and Tukey's multiple comparison test. n=24-153 individual colonies. (D) Pathways enriched in transcripts upregulated in E18.5 Smad7Δ/Δ LT-HSCs using Reactome analysis. (E) Ribosome biogenesis scores in Smad7 f/f or Smad7Δ/Δ LT-HSCs and LK cells were calculated based on the average expression of 322 ribosome biogenesis pathway genes using AddModuleScore in Seurat. Wilcoxon Rank Sum Test. (F) Representative histograms from OP-Puro assay of phenotypic LT-HSCs and LK cells from E18.5 FLs. LT-HSCs from the pregnant dam were used as controls. (G) Relative protein synthesis rates measured by OP-Puro incorporation. One representative experiment is shown. Mean±SD, unpaired, two-tailed Student’s t-test, n=12-15 FLs and 3 independent experiments.

Similar articles

  • Prescription of Controlled Substances: Benefits and Risks.
    Preuss CV, Kalava A, King KC. Preuss CV, et al. 2025 Jul 6. In: StatPearls [Internet]. Treasure Island (FL): StatPearls Publishing; 2025 Jan–. 2025 Jul 6. In: StatPearls [Internet]. Treasure Island (FL): StatPearls Publishing; 2025 Jan–. PMID: 30726003 Free Books & Documents.
  • Short-Term Memory Impairment.
    Cascella M, Al Khalili Y. Cascella M, et al. 2024 Jun 8. In: StatPearls [Internet]. Treasure Island (FL): StatPearls Publishing; 2025 Jan–. 2024 Jun 8. In: StatPearls [Internet]. Treasure Island (FL): StatPearls Publishing; 2025 Jan–. PMID: 31424720 Free Books & Documents.
  • Tetraspanin CD82 regulates transforming growth factor-β signaling in hematopoietic stem and progenitor cells.
    Pascetti E, Floren M, Fernandes TDS, Anastasio C, Doyle L, Gillette J. Pascetti E, et al. Mol Biol Cell. 2025 Jul 1;36(7):br19. doi: 10.1091/mbc.E24-10-0474. Epub 2025 May 28. Mol Biol Cell. 2025. PMID: 40434872
  • Regulation of HSC development and function by Lin28b.
    Cox G, Kobayashi M, Rudd BD, Yoshimoto M. Cox G, et al. Front Cell Dev Biol. 2025 Mar 12;13:1555877. doi: 10.3389/fcell.2025.1555877. eCollection 2025. Front Cell Dev Biol. 2025. PMID: 40143971 Free PMC article. Review.
  • Sickle Cell Disease.
    Bender MA, Carlberg K. Bender MA, et al. 2003 Sep 15 [updated 2025 Feb 13]. In: Adam MP, Feldman J, Mirzaa GM, Pagon RA, Wallace SE, Amemiya A, editors. GeneReviews® [Internet]. Seattle (WA): University of Washington, Seattle; 1993–2025. 2003 Sep 15 [updated 2025 Feb 13]. In: Adam MP, Feldman J, Mirzaa GM, Pagon RA, Wallace SE, Amemiya A, editors. GeneReviews® [Internet]. Seattle (WA): University of Washington, Seattle; 1993–2025. PMID: 20301551 Free Books & Documents. Review.

References

    1. Soares-da-Silva F., Elsaid R., Peixoto M.M., Nogueira G., Pereira P., Bandeira A., and Cumano A. (2023). Assembling the layers of the hematopoietic system: A window of opportunity for thymopoiesis in the embryo. Immunol Rev 315, 54–70. 10.1111/imr.13187. - DOI - PubMed
    1. Kissa K., and Herbomel P. (2010). Blood stem cells emerge from aortic endothelium by a novel type of cell transition. Nature 464, 112–115. nature08761 [pii] 10.1038/nature08761. - DOI - PubMed
    1. Hadland B., and Yoshimoto M. (2018). Many layers of embryonic hematopoiesis: new insights into B-cell ontogeny and the origin of hematopoietic stem cells. Exp Hematol 60, 1–9. 10.1016/j.exphem.2017.12.008. - DOI - PMC - PubMed
    1. Palis J., Robertson S., Kennedy M., Wall C., and Keller G. (1999). Development of erythroid and myeloid progenitors in the yolk sac and embryo proper of the mouse. Development 126, 5073–5084. - PubMed
    1. Frame J.M., Fegan K.H., Conway S.J., McGrath K.E., and Palis J. (2015). Definitive Hematopoiesis in the Yolk Sac Emerges from Wnt-Responsive Hemogenic Endothelium Independently of Circulation and Arterial Identity. Stem cells. 10.1002/stem.2213. - DOI - PMC - PubMed

Publication types

LinkOut - more resources