[Preprint]. 2025 Aug 31:2025.08.28.672520.
doi: 10.1101/2025.08.28.672520.

RNA binding by ADARs prevents RNA interference from attacking self-produced dsRNA

Affiliations

RNA binding by ADARs prevents RNA interference from attacking self-produced dsRNA

Nabeel S Ganem et al. bioRxiv. .

Abstract

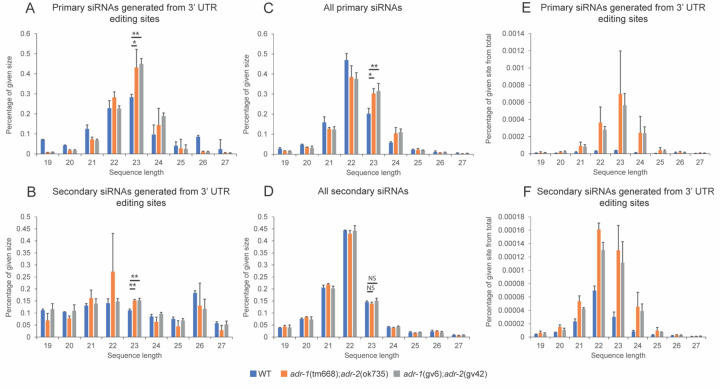
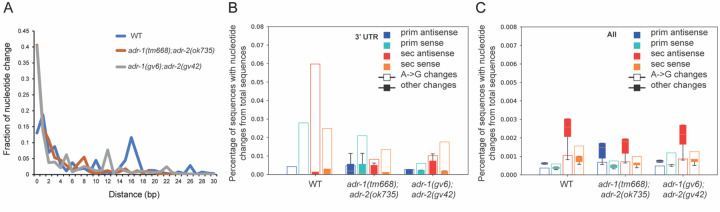
The ability of an organism to identify self and foreign RNA is central to eliciting an immune response in times of need while avoiding autoimmunity. As viral pathogens typically employ double-stranded RNA (dsRNA), host identification, modulation, and response to dsRNA is key. However, dsRNA is also abundant in host transcriptomes, raising the question of how these molecules can be differentiated. Two host pathways that regulate dsRNA are A-to-I RNA editing by adenosine deaminases (ADARs), and RNA interference (RNAi). Both mechanisms are important for normal organism development and function by regulating gene expression. Herein, we studied the structure and amount of siRNAs at editing sites and the ability of ADARs to prevent exogenous RNAi using the model organism, Caenorhabditis elegans. We found that the number of siRNAs targeting edited genes is significantly upregulated in ADAR mutant animals. We also found that despite an almost complete depletion of primary siRNAs generated from editing sites in wildtype animals, secondary siRNAs are generated from edited transcripts, suggesting ADARs antagonize only the first step of RNAi processing. We show that ADARs interfere with the efficacy of exogenous RNAi in vivo, probably to prevent trans-silencing, and have indications that ADR-2 binding to the dsRNA is needed for the efficient prevention of RNAi. This work sheds light on how the RNA editing process protects self-produced dsRNAs from aberrant recognition by the immune processes in the cell and from by-product degradation.


Conflict of interest statement

declaration of interests The authors declare no competing interests.

Figures

Figure 1.
Figure 1.. Genes edited at their 3’UTR are siRNAs enriched in ADAR mutant worms.
Log scale plots presenting normalized mRNA sequence counts (A,B), primary siRNAs sequence counts (C), or secondary siRNAs sequence counts (D) of genes from at least 3 biological replicas in wildtype (N2) worms compared to ADAR mutant worms (adr-1 (tm668); adr-2 (ok735)). Every dot in the graphs represents a gene. The red line is the regression line for all genes. Genes enriched in secondary siRNAs in ADAR mutant worms are marked in cyan (A,B) and their regression line is presented in cyan. Genes enriched in primary siRNAs in ADAR mutant worms are marked in purple (A,B) and their regression line is presented in purple. 3’UTR edited genes are marked in cyan (C,D) their regression line is presented in cyan. egl-2 gene is marked in blue (D).
Figure 2.
Figure 2.. siRNAs are significantly depleted from editing sites in wildtype worms.
Bar plot representing the percentage of antisense siRNA reads in a certain sequence length out of all reads of primary siRNA (A,C) or secondary siRNAs (B,D) aligned to 3’UTR non-repetitive editing sites (A,B) or to all sites (C,D). * p-value < 0.05, ** p-value < 0.01, calculated by one-tail T-test. (E,F) Bar plots showing the percentage of reads overlapping editing sites out of all reads, stratified by read length (19nt-27nt). Reads from enriched primary siRNA sequencing are in (E), and reads from enriched secondary siRNA sequencing are in (F). Wild type counts are shown in blue and ADAR mutants are shown in red (adr-1 (tm668); adr-2 (ok735)) and grey (adr-1 (gv6); adr-2 (gv42)). siRNAs in each sample were estimated independently and stdv is presented.
Figure 3.
Figure 3.. Secondary siRNAs aligned to editing sites contain ADAR editing changes.
A. Distribution of distance between secondary siRNAs and the nearest primary siRNA found. X axis is distance in nucleotides and Y axis is the frequency of the distance in percentage. Wildtype, adr1(tm668); adr-2(ok735)) and adr-1(gv6); adr-2(gv42)) are shown in blue, red and grey, respectively. (B,C) Distribution of percentage of editing events by editing type, stratified by sample type (primary or secondary, sense or anti-sense alignment) and genotype. In each sub-axis, open bars mark the A-to-G change, and filled bars represent the distribution of all other types of editing changes. (B) sites aligned to 3’UTR editing sites. (C) all sites.
Figure 4.
Figure 4.. RNA editing at genes 3’ UTR prevents RNAi efficiency.
(A) A scheme showing RNAi vectors targeting egl-2 3’ UTR; pALNG013 (323 bp) and pALNG014 (182 bp). Asterisks indicate editing sites. (B) Quantification of the fraction of egl-2 phenotype from total worms observed in the RNAi experiments. Abnormal phenotypes that were scored include bloated worms, exploded worms, egg retention, and bag of worms phenotypes. P-values were calculated from at least 3 biological replicas, and the stdv is shown; NS for non-significant, *P-value < 0.05. The mutant strain, rrf-3, was used to control for RNAi hypersensitivity (Simmer et al., 2002). (C) Real-time PCR on RNA produced from worms after RNAi treatment. The empty RNAi plasmid was used for control. The experiment was repeated 3 times. Statistical analysis was done by comparing mutant strains with wildtype under the same RNAi treatment. * P-value < 0.05; Ψ P-value = 0.055103. (D) A scheme showing RNAi vector targeting lem-2 3’ UTR and part of the last exon. Asterisks indicate editing sites. (E) Quantification of the level of LEM-2 protein in WT and ADAR mutant worms after lem-2 RNAi relative to empty vector. LEM-2 protein expression levels were normalized to actin protein levels. The experiment was repeated at least 3 times with similar results. Error bars represent SD. * P-value < 0.05 calculated by unpaired student’s t-test.
Figure 5.
Figure 5.. Mutation that eliminates the deamination ability of ADR-2 does not prevent RNAi.
(A) Quantification of the fraction of egl-2 phenotype from total worms observed in the RNAi experiments. Abnormal phenotypes that were scored include bloated worms, exploded worms, egg retention, and bag of worm phenotypes. adr-2 (G184R) is adr-2 mutated in its deamination domain; P-values were calculated from at least 3 biological replicas, NS for non-significant, *P-value < 0.05. (B) Quantification of the level of LEM-2 protein in wildtype (WT) and ADAR mutant worms. Protein levels were measured following RNAi treatment against lem-2 and compared to those in worms treated with an empty vector. All values were normalized to Actin levels. The experiment was repeated at least 3 times with similar results and SD is presented. Statistical analysis was done by comparing each mutant strain with the wildtype. * P-value < 0.05 calculated by unpaired student’s t-test. (C-E) Log scale plot presenting normalized counts of genes and lncRNA from RNA-seq data at embryo stage in wild-type (WT) worms and ADAR mutant (adr-1 (tm668); adr-2 (ok735)), adr-2 (ok735), adr-2 (G184R)) worms. Every dot represents a gene. Gray dots indicate all genes. Blue dots indicate lncRNA. The black line is the regression line for all genes. The blue line is the regression line for lncRNA.
Figure 6.
Figure 6.. Mutation in the deamination domain of ADR-2 enhances ADR-2 cytoplasmic localization
(A) Immunostaining of wildtype and adr-2(G184R) embryos using ADR-2 antibody. Anti-ADR-2 antibody staining is shown in red in the merge images. Nuclei were visualized with DAPI staining and are shown in blue in the merge images. Scale bar, 10 µm. (B) The fluorescence intensities of ADR-2 in the nucleus and in the cytoplasm were quantified. The graph shows the mean nuclear/cytoplasm ratios in at least 3 cells in each embryo (at least 3) in 3 biological replicates. *P < 0.05. (C) AlphaFold3 ADR-2 X2 (silver) ;ADBP-1X2 (white) tetrameric prediction based on (Mu et al., 2025) with egl-2 RNA (pink). On the left is ADR-2 wildtype, and on the right ADR-2 with G184R mutation. Pink spheres in the RNA are editing sites. In yellow is ADR-2 RNA binding domain, and in blue ADR-2 deaminase domain. ADR-2 184 amino acid is marked in white.

Similar articles

References

    1. Abramson J., Adler J., Dunger J., Evans R., Green T., Pritzel A., Ronneberger O., Willmore L., Ballard A.J., Bambrick J., et al. (2024). Accurate structure prediction of biomolecular interactions with AlphaFold 3. Nature 630, 493–500. - PMC - PubMed
    1. Almeida M.V., Andrade-Navarro M.A., and Ketting R.F. (2019). Function and Evolution of Nematode RNAi Pathways. Noncoding RNA 5, 8. - PMC - PubMed
    1. Anders S., and Huber W. (2010). Differential expression analysis for sequence count data. Genome Biology 11, R106. - PMC - PubMed
    1. Arribere J.A., Kuroyanagi H., and Hundley H.A. (2020). mRNA Editing, Processing and Quality Control in Caenorhabditis elegans. Genetics 215, 531–568. - PMC - PubMed
    1. Ashe A., Bélicard T., Le Pen J., Sarkies P., Frézal L., Lehrbach N.J., Félix M.-A., and Miska E.A. (2013). A deletion polymorphism in the Caenorhabditis elegans RIG-I homolog disables viral RNA dicing and antiviral immunity. Elife 2, e00994. - PMC - PubMed

Publication types