[Preprint]. 2025 Aug 25:2025.08.21.671456.
doi: 10.1101/2025.08.21.671456.

Sequencing of distinct wing behaviors during Drosophila courtship

Affiliations

Sequencing of distinct wing behaviors during Drosophila courtship

Xinping Li et al. bioRxiv. .

Update in

Abstract

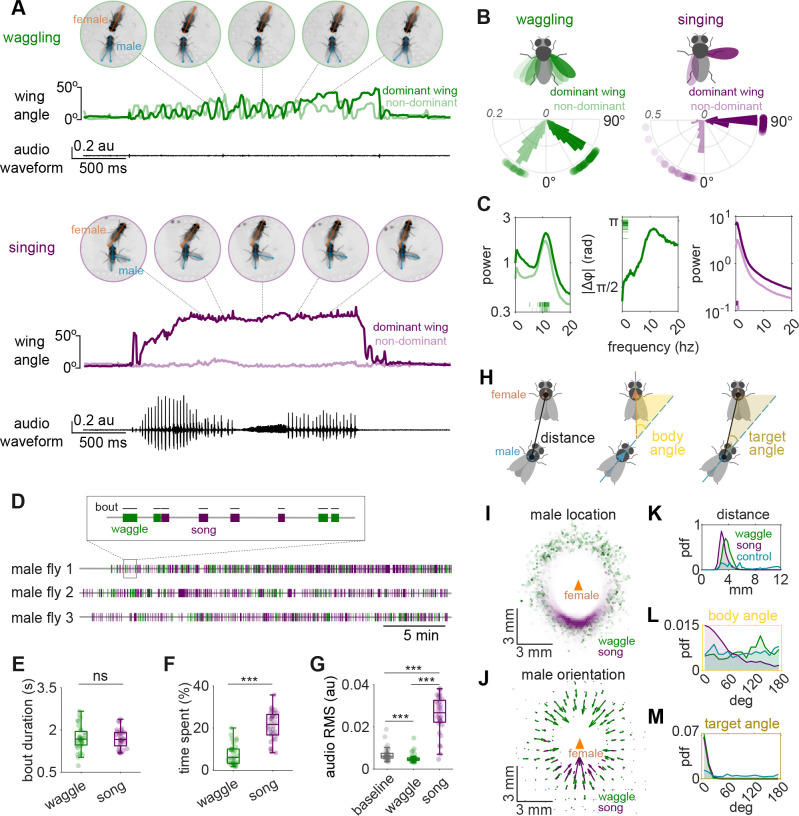
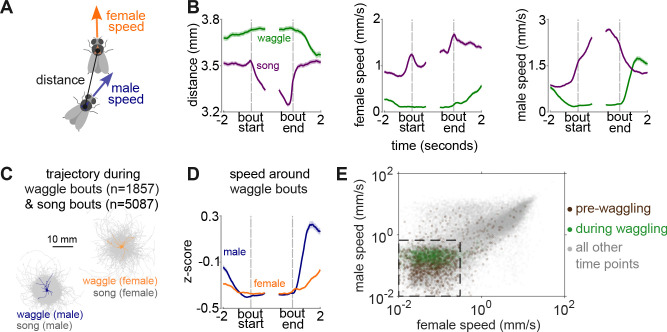
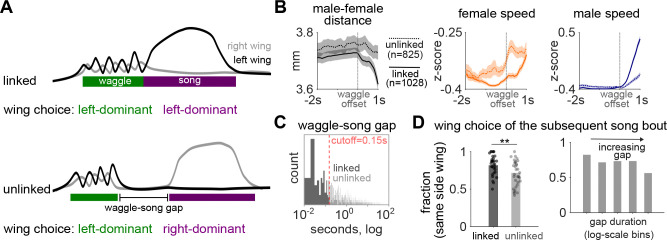
Some behaviors, like biting followed by chewing and then swallowing, unfold in stereotyped sequences, while others, such as limb movements during defensive maneuvers, can be flexibly combined as needed. During courtship, male Drosophilid flies produce a series of actions, including orientation, tapping, singing, licking, and copulation, that follow an ordered but temporally variable sequence [1,2]. At shorter timescales, however, individual actions remain highly dynamic. For example, courtship songs are composed of variable sequences of distinct syllables, with their patterning and amplitude actively shaped by female cues [3-5]. Leveraging recent advances in behavioral quantification [6], we discover a new courtship wing behavior that we term "waggling", which is present across multiple Drosophila species and characterized by rhythmic, anti-phase wing movements. We identify an intermediate level of stereotyped behavioral structure: a directional three-part motif where males and females first decelerate to near-complete stillness, followed by male-initiated waggling, which then transitions into courtship song. Wing kinematics during waggle bouts are predictive of wing choice in subsequent songs, suggesting waggling may serve as a preparatory behavior. We then focus on P1/pC1 neurons, known to promote courtship [5,7-11]. Optogenetic activation of specific P1/pC1 neuron subsets in solitary males, without any female cues, is sufficient to recapitulate the entire stillness-to-waggling-to-singing progression. These findings reveal a new layer of stereotyped structure within a flexible courtship display and demonstrate that P1/pC1 neurons can orchestrate multi-action behavioral programs through internal dynamics.

Keywords: Drosophila; behavioral sequencing; courtship; locomotion; neuroethology; social interactions.


Conflict of interest statement

Declaration of interests The authors declare no competing interests.

Figures

Figure 1.
Figure 1.. Drosophila melanogaster males produce two distinct wing behaviors during courtship
A. An example waggling bout (top) and courtship song bout (bottom). Snapshots (with SLEAP6 skeletons overlaid) indicate discrete moments in each behavior during male/female interactions. Male wing extension angles are different during waggling versus singing (the dominant wing is defined as the wing with greater mean amplitude throughout the bout); waggling involves an oscillatory behavior between the two wings. Waggling does not produce a detectable sound on the microphones (see Methods). B. Wing extension angles. Polar histograms plot the distribution of maximum wing extension angles for waggling (green, 1 857 bouts) and singing (purple, 5087 bouts), the radial axis shows probability density, and dots outside each plot mark the per-fly medians of these peak angles. C. Frequency-domain analysis. Left two panels (green): Mean power spectra (± SEM) of dominant and non-dominant wings during waggling (left) and mean absolute dominant/non-dominant wing phase difference (right); insets show the distribution of each individual fly’s median values. Right-most panel (purple): Mean power spectra (± SEM) of dominant and non-dominant wings during singing. D. Gantt-style timelines plot all waggling (green) and singing (purple) bouts detected in three representative recordings; each horizontal line is one fly pair, and colored bars mark the start-to-end time of individual waggle or song bouts (see Methods). Waggling and singing both occur throughout courtship. E. Waggle and song bout durations are comparable (paired t-test, p=0.901; ns, not significant). F. Males spend a larger fraction of the recording singing versus waggling (Wilcoxon signed-rank test, *** p < 0.001). G. RMS (Root Mean Square) microphone amplitude is highest during song bouts, intermediate at baseline, and lowest during waggling bouts (Friedman test with Wilcoxon post-hoc, *** p < 0.001). H. Spatial geometry of the courting male relative to the female (see Methods). I. Female-centered map of male location during waggling (green) or singing (purple). The orange triangle marks the female thorax and her orientation. Males stay close in both behaviours but, whereas singing occurs mostly directly behind the female, waggling is produced all around the female. J. Female-centered quiver plot of male orientation during waggling (green) or singing (purple). Males orient towards the female during both behaviors. K-M. Distributions of male–female spatial parameters (see H). Probability-density functions show (K) distance, (L) body angle, and (M) target angle during waggling (green), singing (purple) and control (cyan; frames that precede the first waggle or song frame in each recording). N=32 males across panels B-C and E-M. For E-G, box plots show median ± IQR, whiskers extend to 1.5×IQR. Dots mark the individual per-fly medians.
Figure 2.
Figure 2.. Locomotor dynamics differ around waggle versus song bouts
A. Parameters analyzed: the distance between the male and female thorax, the speed of the male or female, along with their heading directions. B. Bout-triggered averages (mean ± SEM) of male–female distance (left), female speed (middle), and male speed (right) aligned to bout start and end. Green: waggle bouts; purple: song bouts. Waggle occurs at larger male-female distances and slower speeds relative to song. C. Male and female trajectories during individual waggle (male: navy; female: orange) and song bouts (gray). All trajectories are centered on the bout start position. D. Z-scored speeds around waggle bouts. Bout-triggered averages after z-scoring speeds within individual animal recordings (same data as B but z-scored). E. Scatter plot of male versus female speeds during pre-waggling (brown, 1 s before bouts), waggling (green, entire bout averages), and all other times (gray, 1 s bins). Boxed region marks the “stillness” zone (0 -- 0.67 mm/s male, 0 -- 0.3 mm/s female; defined in Figure S2). N=32 male-female pairs in B-E.
Figure 3.
Figure 3.. Waggling is linked to singing
A. A waggle bout can either be directly followed by song (top: “linked” waggle) or not (bottom: “unlinked” waggle). In either case, males can use the same wing as dominant during waggling and subsequent singing (shown at top) or they can switch the dominant wing between the two behaviors (shown at bottom). B. Locomotor dynamics around waggle bout ends for linked (solid lines) and unlinked (dashed lines) transitions to song. Bout-triggered averages (mean ± SEM) of male–female distance (left) and speeds (female: middle; male: right) aligned to waggle bout ends. Linked waggles involve a steep drop in male-female distance as males transition from waggling to singing, as well as a sharp increase in male and female speeds. C. Distribution of gap durations between the end of waggle bouts and the start of the subsequent song bout. The red dashed line marks the cutoff (0.15 s) separating linked and unlinked transitions (see Methods). D. Wing choice in song bouts following waggling. Left panel: Fraction of song bouts where the dominant wing matches the dominant wing of the preceding waggle bout for unlinked and linked transitions. Dots mark individual animals (paired t-test, **p < 0.01). Right panel: Same data binned by waggle–song gap duration (log-scale bins: 0.007–0.046 s, n=947; 0.046–0.312 s, n=145; 0.312–2.138 s, n=290; 2.138–14.630 s, n=393; 14.630–100.133 s, n=78). The more linked the waggle and song bouts are, the more likely the dominant wing will be the same for the two behaviors. N=32 males in B-D.
Figure 4.
Figure 4.. Sequencing of stillness, waggling, and singing.
A-B. Bout-to-bout behavioral state transitions. Network diagram (A) and transition probability matrix (B) showing probabilities of transitioning between three different kinds of ‘bouts’: stillness, waggling, and singing. Only three states are shown for clarity (see Figure S4 for full four-state matrix that includes “other” for all other behaviors produced during courtship); probabilities do not sum to 1 as transitions to the “other” state are excluded. Solid arrows and asterisks indicate statistically significant transitions (one-tailed permutation test, ***p < 0.001). See Methods for stillness, waggling and singing bout definitions. C. Three-gram transition probabilities. Bars show probability of each three-bout sequence, with counts above. Word cloud shows the most frequent three-gram sequences, with font size scaled to frequency. D. Representative sequence from stillness to waggling and to singing. Wing angles (dominant in black and non-dominant in gray), audio recordings, and male (blue) and female (orange) speeds during a single recording (see Video S5). E. Conceptual models of behavioral sequencing during courtship. Left: Self-transitory model: male’s internal dynamics drive behavioral transitions, with female sensory cues modulating the probability of staying in or exiting each state. Right: Cue-dependent model: female sensory cues directly drive transitions from one behavior to the next. N=32 male-female pairs in A-C.
Figure 5.
Figure 5.. P1 neuronal subsets drive behavioral sequences that include waggling
A. Experimental design. Optogenetic activation of P1 neuronal subsets to investigate the production of slowing, waggling, and singing states in the absence of female cues. B. Optogenetic stimulation protocol (see Methods). A one second light pulse (of varying amplitude) delivered every 30 seconds across the stimulation block. C. Behavioral responses across 11 different genotypes targeting different P1 neuronal subsets. Left: Anatomical expression patterns. Right: Mean ± SEM walking speed (blue) aligned to LED light onset (red bar), with waggling (green) and singing (purple) probabilities. Genotypes with red labels exhibit robust activation of the full behavioral sequence (slowing → waggling → singing). D. Summary of optogenetically-induced speed responses across genotypes. Violin plots show distribution across animals for baseline speed (top; prior to the start of optogenetic stimulation), block speed (middle; speed during the entire optogenetic block), and percentage change (bottom; calculated as (during-pre)/pre, comparing speed during optogenetic stimulation (when red LED is on) to pre-stimulation baseline). E. Latency from optogenetic onset to behavioral responses in genotypes that drive the full behavioral sequence. Violin plots show distribution across trials for peak deceleration (blue), waggling onset (green), and singing onset (purple). Friedman test within each genotype (***p < 0.001). F. Optogenetic epoch-triggered averages (mean ± SEM) aligned to optogenetic onset in genotypes driving the full behavioral sequence, split by whether stimulation evoked (red) or did not evoke (black) the behavioral sequence. G. Network of genetic driver combinations for P1 neurons and functional outcomes. Connections indicate genetic driver combinations; those producing full behavioral sequences are indicated in red, others in gray. See Table S1 for full information on genetic driver lines. N = 17 (dsx_fru), 15 (np_dsx), 14 (np_fru), 19 (r71_dsx), 15 (r71_fru), 19 (split1/split P1a), 18 (split2), 19 (split3), 19 (split4), 19 (split5), 18 (split6) males. Violin plots show median and quartiles (black lines, in D and E) and means (white circles, in E).

References

    1. Anderson DJ, Perona P. Toward a science of computational ethology. Neuron. 2014;84: 18–31. - PubMed
    1. Yamamoto D, Koganezawa M. Genes and circuits of courtship behaviour in Drosophila males. Nat Rev Neurosci. 2013;14: 681–692. - PubMed
    1. Coen P, Clemens J, Weinstein AJ, Pacheco DA, Deng Y, Murthy M. Dynamic sensory cues shape song structure in Drosophila. Nature. 2014;507: 233–237. - PubMed
    1. Coen P, Xie M, Clemens J, Murthy M. Sensorimotor transformations underlying variability in song intensity during Drosophila courtship. Neuron. 2016;89: 629–644. - PMC - PubMed
    1. Roemschied FA, Pacheco DA, Aragon MJ, Ireland EC, Li X, Thieringer K, et al. Flexible circuit mechanisms for context-dependent song sequencing. Nature. 2023;622: 794–801. - PMC - PubMed

Publication types