[Preprint]. 2025 Aug 29:2025.08.27.25334571.
doi: 10.1101/2025.08.27.25334571.

Proteomic prediction of disease largely reflects environmental risk exposure

Affiliations

Proteomic prediction of disease largely reflects environmental risk exposure

Kristin Tsuo et al. medRxiv. .

Abstract

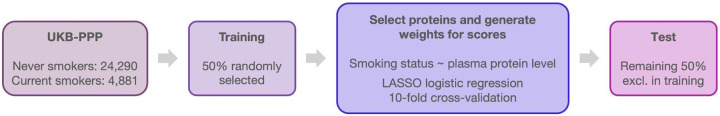
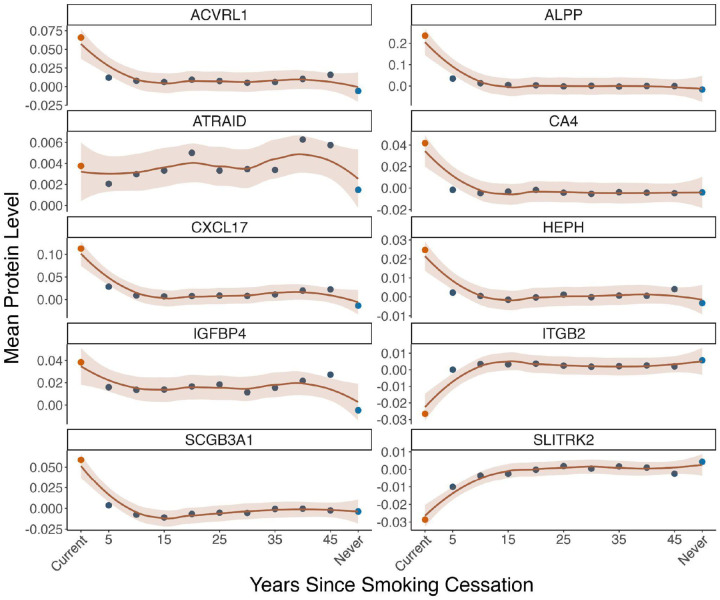
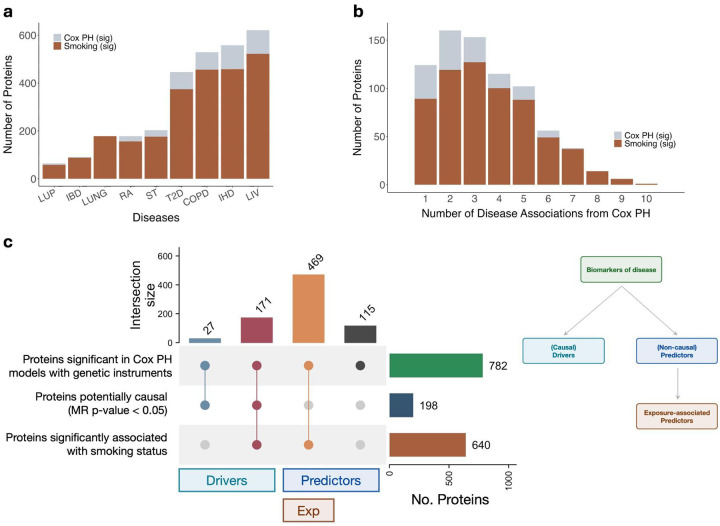
Plasma proteomic signatures accurately predict disease risk, but our understanding of the mechanisms contributing to the predictive value of the proteome remains limited. Here, we characterized proteomic biomarkers of 19 age-related diseases, based on observational associations between 2,923 protein levels and incidence of these outcomes in the UK Biobank (N = 45,438). To identify the subset of these biomarkers that may represent causal drivers of disease, we first employed Mendelian Randomization (MR) and found that only 8% of the protein-disease associations with genetic instruments showed suggestive evidence of causal relationships, and were more likely to pertain to only a single disease. We then tested the hypothesis that many proteomic biomarkers, particularly the non-causal proteins, are impacted by environmental factors that might independently affect disease risk and protein levels. We discovered that the vast majority (>90%) of proteins associated with diseases like lung cancer and COPD are also associated with smoking, and more than half of all disease-associated proteins tested in MR were associated with smoking. These proteins showed no evidence of causal effects on disease, suggesting their predictive value is as an environmental sensor. Given the sensitivity of the plasma proteome to smoking, we developed a proteomic score for smoking (SmokingPS) and demonstrated that the plasma proteome can serve as a quantitative index of smoking behavior and history. Extending this approach to alcohol intake phenotypes, our results generally suggest that many plasma proteins identified in observational associations are more likely to be readouts of environmental risk factors than disease-specific signals. We conclude that the plasma proteome may provide critical objective biomarkers for quantifying the impacts of environmental risk factors on human health and disease. Our results have significant implications for implementing predictive plasma protein biomarkers in disease prevention, and can help guide interpretation of putative protein-disease associations as actionable therapeutic targets or quantitative indications of upstream exposures that represent potential intervention points.


Figures

Extended Data Fig. 1.
Extended Data Fig. 1.. Number of associations between plasma proteins and 22 incident disease outcomes.
9,308 significant associations involving 2,122 proteins and 22 incident disease outcomes are shown (Bonferroni-adjusted P-value < 7.44 × 10⁻⁷). (MS = multiple sclerosis; MDD = major depressive disorder; Colorectal = colorectal cancer; ALS = amyotrophic lateral sclerosis; GYN = gynecological cancers; CYS = cystitis; Breast = breast cancer; Prostate = prostate cancer; PD = Parkinson’s disease; SCZ = schizophrenia; ENDO = endometriosis; AL = Alzheimer’s dementia; VD = vascular dementia; LUP = systemic lupus erythematosus; LUNG = lung cancer; IBD = inflammatory bowel disease; RA = rheumatoid arthritis; ST = ischemic stroke; COPD = chronic obstructive pulmonary disease; IHD = ischemic heart disease; LIV = Liver disease; T2D = Type 2 diabetes)
Extended Data Fig. 2.
Extended Data Fig. 2.. Performance of disease-based proteomic scores from Gadd et al.
Differences in AUC between models with standard covariates and models with the addition of the disease ProteinScores (PS). Disease ProteinScores were developed and described in Gadd et al. In blue (baseline), models without PS consist of age and sex in which diseases were not sex-stratified. In red (smoking), models without PS consist of age, sex, and self-reported smoking status. To the right of the plot, the first column of numbers shows the differences in AUC with the addition of the PS per model; the second column shows Δ+PS in baseline minus Δ+PS in smoking.
Extended Data Fig. 3.
Extended Data Fig. 3.. Summary of SmokingPS development.
UKB-PPP participants who self-reported never and current smoking status were used for developing the SmokingPS. 50% were randomly assigned to the training group; the remaining 50% were assigned to the test group. Ratios of never to current smokers in each group were similar. LASSO regression with 10-fold cross validation was used to select proteins out of the 2,923 proteins measured and derive weighting coefficients for the selected proteins.
Extended Data Fig. 4.
Extended Data Fig. 4.. SmokingPS distributions in FinnGen and across previous and current smokers in UKB.
a, Density plot of the SmokingPS in FinnGen participants (N = 1,862), stratified by self-reported never and current/previous smoking status. Current and previous smokers are grouped together due to gaps in timing between the collection of smoking information and proteomic sampling. b, Density plot of SmokingPS with self-reported previous smokers in UKB stratified by pack years, calculated as number of cigarettes smoked per day, divided by twenty, multiplied by number of years smoking. c, Density plot of SmokingPS with self-reported current smokers divided into bins of SmokingPS at 0.10, 0.25, 0.50, 0.75, and 0.90 quantiles. Cigarettes smoked per day were averaged across individuals in each bin; each average is reported on the density plot.
Extended Data Fig. 5.
Extended Data Fig. 5.. Average protein levels of top-weighted proteins in SmokingPS across groups of previous smokers.
X-axis represents years since smoking cession, grouped in 5-year intervals for former smokers: (0,5], (10,15], etc. Average protein levels in current smokers and never smokers are included for reference.
Extended Data Fig. 6.
Extended Data Fig. 6.. Comparison of SmokingPS and other models for prediction of incident COPD and liver disease.
Associations between incident disease and models with various predictors, shown on y-axis, using Cox PH. Baseline model includes age, sex, age2, age × sex, age2 × sex, and first 10 genetic PCs. All models following baseline include these variables, as well as the predictor listed. “CRP” indicates C-reactive protein. “Immune cell counts” include neutrophil, eosinophil, basophil, monocyte, lymphocyte, and white blood cell counts. “All” indicates the baseline variables, smoking status, SmokingPS, CRP, and immune cell counts. C-index is shown on the x-axis and listed alongside 95% confidence intervals. a, Incident disease outcome is COPD (cases = 1,973, controls = 44,765). b, Incident disease outcome is liver disease (cases = 328, controls = 46,913).
Extended Data Fig. 7.
Extended Data Fig. 7.. SmokingPS in individuals with lung cancer stratified by smoking status.
a, Density plot of SmokingPS in individuals with lung cancer, stratified by self-reported smoking status. b, Density plot of SmokingPS in never smokers, stratified by incident lung cancer outcome. c, Cox PH associations between incident lung cancer and (1) baseline model of age, sex, age2, age × sex, age2 × sex, and first 10 genetic PCs and (2) baseline model with SmokingPS. Cox PH associations were conducted in individuals stratified by self-reported smoking status.
Extended Data Fig. 8.
Extended Data Fig. 8.. Comparisons of AlcoholPS and SmokingPS, and AlcoholPS trained in females and males separately.
a, Density plot of AlcoholPS in individuals with self-reported smoking information, stratified by smoking status. b, Density plot of SmokingPS in individuals with self-reported alcohol intake information, stratified by alcohol drinker status. Density plot of AlcoholPS in current drinkers stratified by self-reported number of drinks per week or month in c, females and e, males. Self-reported never drinkers shown for reference. Density plot of AlcoholPS in current drinkers stratified by derived grams of alcohol intake per day in d, females and f, males.
Extended Data Fig. 9.
Extended Data Fig. 9.. Associations between liver biomarkers and AlcoholPS.
Comparisons of variance explained in liver biomarkers on y-axis by AlcoholPS and a, daily vs. never drinking status or b, current vs. never drinking status. Incremental R2 was estimated as improvement in R2 with inclusion of either AlcoholPS or alcohol intake status, comparing the two models: (1) baseline model (biomarker ~ age + sex + age2 + age*sex + age2*sex) and (2) full model (biomarker ~ AlcoholPS or alcohol intake status + age + sex + age2 + age*sex + age2*sex. (ALT = alanine aminotransferase, AST = aspartate aminotransferase, GGT = gamma-glutamyl transferase)
Figure 1.
Figure 1.. Study design for characterizing proteomic biomarkers of disease.
a, We tested for associations between 2,923 plasma proteins measured in a subset of UKB-PPP participants and 23 incident disease outcomes using Cox proportional hazards (PH) models. We refer to the proteins in the significant protein-disease associations as biomarkers. b, To better understand the protein-disease associations identified in (a), we took two approaches. First, we identified which of the protein-disease associations were likely causal by applying two-sample Mendelian Randomization (MR) using protein quantitative trait loci (pQTLs) as genetic instruments and disease GWAS that did not utilize UKB data; we refer to the putatively causal proteins as drivers. Second, we identified proteins that are likely not causal themselves but instead reflect the effects of disease-related exposures, by identifying proteins that were significantly associated with smoking but lacking evidence from MR; we refer to these proteins as exposure-associated predictors. c, We trained a LASSO regression model on the subset of UKB-PPP participants with smoking status data to develop a protein score for smoking (SmokingPS). We demonstrated that the SmokingPS accurately captures quantity and frequency of smoking and used SmokingPS to predict disease incidence.
Figure 2.
Figure 2.. Comparison of proteins involved in observational vs. causal associations across diseases.
a, Counts of proteins significantly associated with diseases in Cox PH models and that also had genetic instruments (N = 782 proteins involved in 2,907 protein-disease pairs). Diseases with more than 20 significant protein associations are shown. Counts of the subset of these proteins showing suggestive evidence of causality from MR analyses (P-value < 0.05) are indicated by darker blue bars. b, Counts of proteins associated with 1 to more than 10 diseases in the Cox PH models vs. MR tests. All proteins shown here are involved in the 2,907 protein-disease pairs that were significant in Cox PH models and had genetic instruments. Light blue bars represent non-causal predictors; dark blue bars represent causal drivers. Inset shows 27 proteins significantly associated with 8 or more diseases in the Cox PH models (IBD = inflammatory bowel disease; LUP = systemic lupus erythematosus; RA = rheumatoid arthritis; ST = ischemic stroke; LUNG = lung cancer; COPD = chronic obstructive pulmonary disease; T2D = Type 2 diabetes; LIV = Liver disease; IHD = ischemic heart disease, Breast = breast cancer; Colorectal = colorectal cancer; VD = vascular dementia).
Figure 3.
Figure 3.. Smoking associations categorize many biomarkers as exposure-associated predictors.
a, Counts of proteins significantly associated with diseases in Cox PH models, with counts of the subset of these proteins significantly associated with smoking status (across the entire UKB dataset) highlighted by orange bars. Diseases with more than 20 significant protein associations are shown (IBD = inflammatory bowel disease; LUP = systemic lupus erythematosus; RA = rheumatoid arthritis; ST = ischemic stroke; LUNG = lung cancer; COPD = chronic obstructive pulmonary disease; Diab = Type 2 diabetes; LIV = Liver disease; IHD = ischemic heart disease). b, Counts of proteins significantly associated with 1 to 10 diseases in the Cox PH models, with counts of the subset of proteins in each category significantly associated with smoking status highlighted by orange bars (Bonferroni-adjusted P-value < 1.7 × 10⁻⁵). c, UpSet plot showing the classification of 782 proteins significantly associated with a disease (Bonferroni-adjusted P-value < 0.05/(19 diseases × 2,923 proteins) = 9.00 × 10⁻⁷ from Cox PH associations) for which a genetic instrument existed. Significant association with smoking status was determined based on Bonferroni-adjusted P-value < 0.05/2,923 = 1.7 × 10⁻⁵. Groups delineated as causal drivers, non-causal predictors, and exposure-associated predictors are indicated by bars on the bottom, and illustrated in the schematic on the right.
Figure 4.
Figure 4.. SmokingPS captures different smoking measures and predicts incident disease.
a, Density plot of SmokingPS with individuals stratified by self-reported smoking status. b, Density plot of SmokingPS with self-reported previous smokers stratified by number of years since smoking cessation. c, Density plot of SmokingPS with self-reported current smokers stratified by pack years, calculated as number of cigarettes smoked per day, divided by twenty, multiplied by number of years smoking. d, Associations between incident lung cancer (cases = 405, controls = 46,968) and models with various predictors, shown on y-axis, using Cox PH. Baseline model includes age, sex, age, age × sex, age × sex, and first 10 genetic PCs. All models following baseline include these variables, as well as the predictor listed. “CRP” indicates C-reactive protein. “Immune cell counts” include neutrophil, eosinophil, basophil, monocyte, lymphocyte, and white blood cell counts. “All” indicates the baseline variables, smoking status, SmokingPS, CRP, and immune cell counts. C-index is shown on the x-axis and listed alongside 95% confidence intervals.
Figure 5.
Figure 5.. AlcoholPS captures frequency and amount of alcohol intake in current drinkers.
a, Density plot of AlcoholPS in current drinkers stratified by self-reported number of drinks per week or month. Self-reported never drinkers shown for reference. b, Density plot of AlcoholPS in current drinkers stratified by derived grams of alcohol intake per day.

References

    1. Gudjonsson A. et al. A genome-wide association study of serum proteins reveals shared loci with common diseases. Nat. Commun. 13, 480 (2022). - PMC - PubMed
    1. Emilsson V. et al. Co-regulatory networks of human serum proteins link genetics to disease. Science 361, 769–773 (2018). - PMC - PubMed
    1. Sun B. B. et al. Genomic atlas of the human plasma proteome. Nature 558, 73–79 (2018). - PMC - PubMed
    1. Ferkingstad E. et al. Large-scale integration of the plasma proteome with genetics and disease. Nat. Genet. 53, 1712–1721 (2021). - PubMed
    1. Koprulu M. et al. Proteogenomic links to human metabolic diseases. Nat. Metab. 5, 516–528 (2023). - PMC - PubMed

Publication types

LinkOut - more resources