. 2025;6(1):691.
doi: 10.1038/s43247-025-02611-8. Epub 2025 Sep 2.

Snowfall decrease in recent years undermines glacier health and meltwater resources in the Northwestern Pamirs

Affiliations

Snowfall decrease in recent years undermines glacier health and meltwater resources in the Northwestern Pamirs

Achille Jouberton et al. Commun Earth Environ. 2025.

Abstract

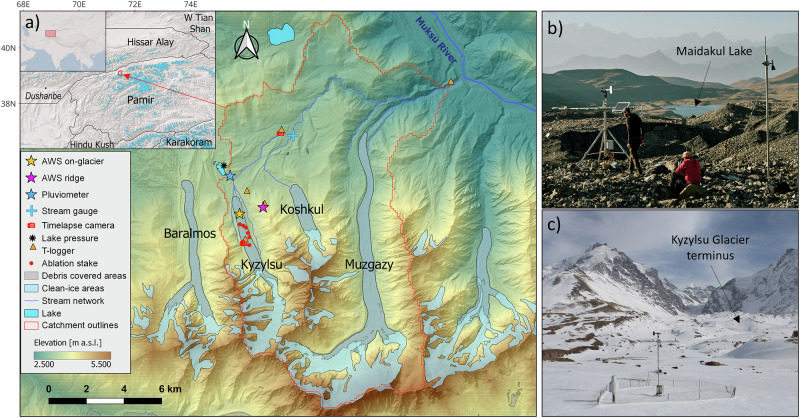
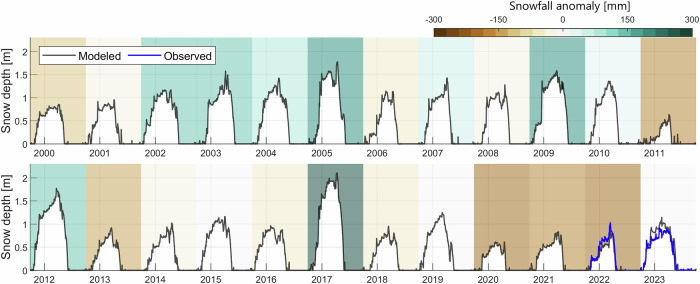
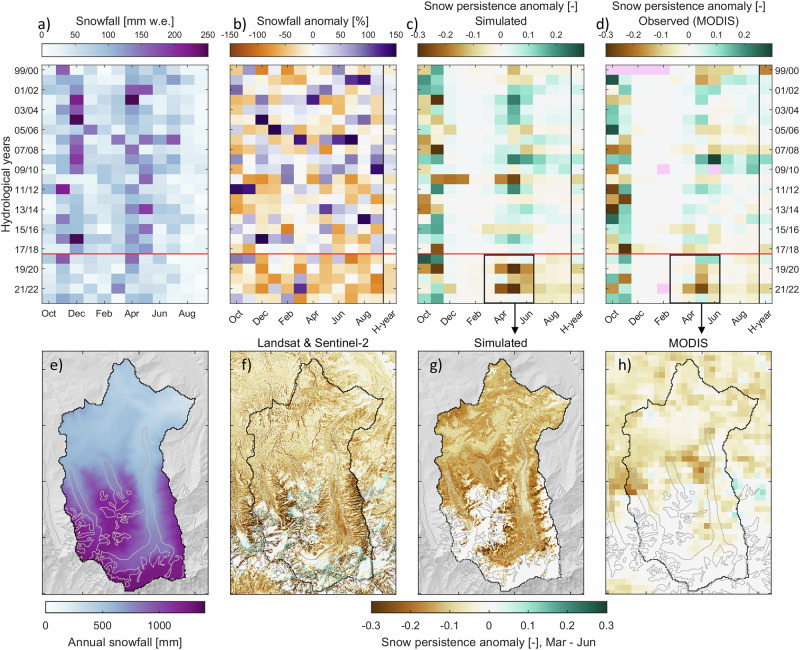
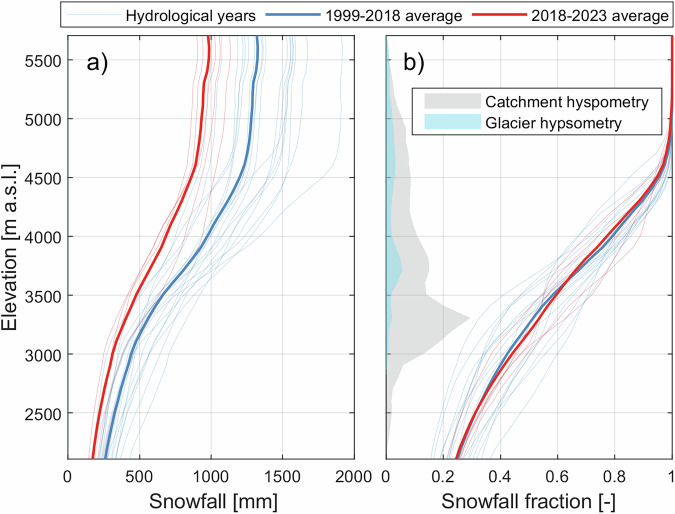
Central Asia hosts some of the world's last relatively healthy mountain glaciers and is heavily dependent on snow and ice melt for downstream water supply, though the causes of this stable glacier state are not known. We combine recent in-situ observations, climate reanalysis and remote sensing data to force a land-surface model to reconstruct glacier changes over the last two decades (1999-2023) and disentangle their causes over a benchmark glacierized catchment in Tajikistan. We show that snowfall and snow depth have been substantially lower since 2018, leading to a decline in glacier health and reduced runoff generation. Remote-sensing observations confirm wider snow depletion across the Northwestern Pamirs, suggesting that a lack of snowfall might be a cause of mass losses regionally. Our results provide an explanation for the recent decline in glacier health in the region, and reinforce the need to better understand the variability of precipitation.

Keywords: Cryospheric science; Hydrology.


Conflict of interest statement

Competing interestsThe authors declare no competing interests.

Figures

Fig. 1
Fig. 1. Study site and its monitoring network.
a Map of the Kyzylsu catchment. The names of the main glaciers are indicated in black. The elevation information is taken from the AW3D Digital Elevation Model (DEM), while the hillshade was derived from high-resolution Pleiades DEMs acquired in 2022 and 2023. Glacier outlines and debris extents are from the RGI 6.0 inventory. Lakes were manually delineated from a Pléiades 2022 ortho-image. The inset maps show the location of the study site in Central Asia with a base map from Esri, along with glaciers shown as blue areas and sub-regions outlines from the RGI 6.0 inventory. b Picture taken by Jason Klimatsas in September 2023 of the on-glacier automatic weather station, located on the debris-covered portion of Kyzylsu Glacier. Maidakul Lake can be seen in the background,as indicated by an arrow. c Pluviometer station photographed by a time-lapse camera in March 2022, with the snow-covered terminus of Kyzylsu Glacier visible in the background. Photos of all other hydrometeorological stations are shown in Supplementary Fig. S1.
Fig. 2
Fig. 2. Snow depth reconstruction since 1999.
Simulated daily snow depth at the pluviometer station (3369 m a.s.l.) since October 1999 (in black) and measured from 20/09/2021 to 30/09/2023 (when data are available, in blue). The colored shaded background indicates the annual snowfall anomaly of the corresponding hydrological year (from October 1st to September 30th).
Fig. 3
Fig. 3. Decline in snowfall, snow depth and snow cover at Kyzylsu catchment.
a Mean monthly snowfall amounts averaged over the catchment area. b Mean monthly snowfall anomaly relative to the mean of all years in a given month. c Simulated snow persistence anomaly and d snow persistence anomaly derived from the MODIS daily snow cover product, where pink-colored pixels indicate an absence of data for the corresponding month. H-year in panels (bd) refers to the hydrological year (October 1st to September 30th). The horizontal red line shown in (ad) separates the first (1999–2018) and the second, drier sub-period (2018–2023). e Simulated annual snowfall average over the whole period (1999–2023). fh Changes in mean snow persistence between 2018–2023 and 1999–2018 for the months of March to June observed by Landsat 5/7/8/9 and Sentinel-2 imagery (f), simulated by the land-surface model (g) and observed by MODIS (h), using only dates for which Landsat 5/7/8/9 or Sentinel-2 scenes are available and cloud-free. Glacier outlines shown as gray lines in (eh) are from the RGI 6.0 inventory.
Fig. 4
Fig. 4. Simulated annual snowfall, snowfall fraction and area fraction per elevation.
a Snowfall per elevation for each hydrological year (thin lines) and averaged over the 1999–2018 and 2018–2023 periods (thick lines). b Same as (a) but for the snowfall fraction, i.e. the fraction of total precipitation that falls in the solid form. The hypsometry of the catchment and its glaciers are shown as gray and blue shaded areas, respectively.
Fig. 5
Fig. 5. Mass balance changes at Kyzylsu Glacier simulated since 1999.
Shaded areas indicate annual time series of mass inputs (seasonal snowfall, avalanches) and mass losses (icemelt, snowmelt, evapotranspiration, sublimation). These mass balances components add up to the net glacier mass balances (GMB), shown as vertical bars for each hydrological year and as a red line for a 5-year moving average. The 2000–2019 geodetic mass balance shown as a solid purple line and its uncertainty shown as a shaded area are from Hugonnet et al.. Mean annual air temperature deviations from the period average are shown on top of the figure as colored rectangles.
Fig. 6
Fig. 6. Surface mass balance of glaciers simulated at Kyzylsu catchment.
a Surface mass balance per 100-m elevation band for Kyzylsu Glacier, with shaded areas indicating one standard deviation. The glacier hypsometry (in km2) is shown on the right of the panel. Spatially distributed surface mass balance for the 1999–2018 (b) and 2018–2023 (c) periods. The mean glacier-wide surface mass balance (SMB) of Kyzylsu Glacier is indicated in a textbox, while the equilibrium line altitude (ELA) is drawn as a dashed purple line. The hillshade information shown in the background of (b, c) is taken from the AW3D DEM resampled to the spatial resolution of the model simulations (100 m).
Fig. 7
Fig. 7. Water fluxes and contributions to runoff generation at Kyzylsu catchment.
Water fluxes averaged per elevation band over the periods 1999–2018 (a) and 2018–2023 (b). c Changes in water fluxes per elevation band between the two sub-periods. d Catchment hypsometry used to convert the altitudinal fluxes into volumes in (ac), with shaded areas corresponding to different land cover types. e, f same as (ac) but averaged per calendar month over the catchment area. The net runoff shown as a black dotted line is the sum of all the other variables displayed. The numbers (in %) given in the legends of (e, f) correspond to the relative contribution to the total runoff generation.
Fig. 8
Fig. 8. Regional anomalies in precipitation and snow cover, comparing 2000–2018 and 2018–2023.
a Anomaly in mean snow cover persistence derived from the daily MODIS snow cover product (MOD10A1.061), focusing on the March to June period. Areas experiencing a snow cover anomaly similar to or larger than our study site are indicated by black crosses. b Regional anomaly in annual precipitation from ERA5-Land. Areas experiencing a precipitation anomaly similar to or larger than our study site are outlined in light blue. World administrative boundaries (countries and territories) are indicated as black solid lines, and glaciers from the RGI 6.0 inventory are shown as light gray solid lines. Our study site is located at the center of the map and is indicated by a black box.

References

    1. Hugonnet, R. et al. Accelerated global glacier mass loss in the early twenty-first century. Nature592, 726–731 (2021). - PubMed
    1. Kraaijenbrink, P. D. A., Stigter, E. E., Yao, T. & Immerzeel, W. W. Climate change decisive for Asia’s snow meltwater supply. Nat. Clim. Change 2021 11:711, 591–597 (2021).
    1. Maussion, F. et al. Precipitation seasonality and variability over the Tibetan Plateau as resolved by the High Asia reanalysis. J. Clim.27, 1910–1927 (2014).
    1. Huang, L. et al. Winter accumulation drives the spatial variations in glacier mass balance in High Mountain Asia. Sci. Bull.67, 1967–1970 (2022). - PubMed
    1. Sakai, A. & Fujita, K. Contrasting glacier responses to recent climate change in High-Mountain Asia. Sci. Rep.7, 13717 (2017). - PMC - PubMed

LinkOut - more resources