. 2025 Dec;17(1):2546998.
doi: 10.1080/19490976.2025.2546998. Epub 2025 Sep 5.

Metabolomics reveal distinct molecular pathways associated with future risk of Crohn's Disease

Affiliations

Metabolomics reveal distinct molecular pathways associated with future risk of Crohn's Disease

Mingyue Xue et al. Gut Microbes. 2025 Dec.

Abstract

Host - microbiome interactions are central to Crohn'sdisease (CD) pathogenesis; yet the early metabolic alterations that precededisease onset remain poorly defined. To explore preclinical metabolicsignatures of CD, we analyzed baseline serum metabolomic profiles in a nestedcase-control study within the Crohn's and Colitis Canada - Genetics, Environment, Microbiome (CCC-GEM) Project, a prospective cohort of 5,122 healthyfirst-degree relatives (FDRs) of CD patients. We included 78 individuals wholater developed CD and 311 matched FDRs who remained disease-free. In an untargetedassessment of metabolomic data, we identified 63 metabolites significantlyassociated with future CD risk. Integrative analyses further identifiedmultiple associations between CD-related metabolites and proteomic markers, gutmicrobiome composition, antimicrobial antibody, fecal calprotectin andC-reactive protein. Quinolinate, a tryptophan catabolite, was elevated inindividuals who later developed CD and showed strong positive correlations withC-reactive protein, fecal calprotectin, and C-X-C motif chemokine ligand 9 (CXCL9).In contrast, higher levels of ascorbate and isocitrate were associated withreduced CD risk and were negatively correlated with C-reactive protein and CD-associated proteins.These findings identify several distinct molecular pathways that contribute toCD pathogenesis.

Keywords: Inflammatory bowel disease; Ruminococcus torques; gut barrier function; risk biomarkers.


Conflict of interest statement

No potential conflict of interest was reported by the author(s).

Figures

Figure 1.
Figure 1.
Metabolites associated with future development of CD (A)Volcano plot showing each metabolite’s association with future CD development. The x-axis represents the log of or for CD, and the y-axis shows the log10 of the q-value (log transformation for visualization). Conditional logistic regression, adjusted for CD-multiplex family and relation to proband, was used. Red dots represent metabolites significantly upregulated in the pre-CD (q-value < 0.05 and OR > 1); and blue dots represent metabolites significantly downregulated (q-value < 0.05 and OR < 1). Metabolites abundance values were autoscaling-transformed for comparability(mean-centered, unit-variance scaled), expressed in SD units relative to the cohort mean for each metabolite. (B) A boxplot showing the distribution of the 10 most significant metabolites in the pre-CD and HC groups, based on the regression analysis in (A). Light blue dots denote pre-CD individuals, and dark blue dots represent HC individuals. The q-value for each metabolite (same as in A) is displayed above the corresponding pair of boxplots. The Y-axis represents autoscaling-transformed metabolite abundance. (C) Among 63 pre-CD-associated metabolites, 36 had a correlation coefficient above |0.6|, forming nine internal clusters. Partial Spearman’s rank correlation account for the matching factors was used to determine intra-cluster correlation (see methods). Metabolites in these clusters are colored by their super pathway as defined by Metabolon, Inc. Lines between metabolites indicate a correlation coefficient > |0.6|. Feature names include known metabolites and unknowns labeled with “X”- identifiers. ** indicates a compound putatively identified by Metabolon Inc. through matching to its proprietary spectral libraries and orthogonal analytical evidence without a chemical standard; * indicates a compound putatively characterized to a chemical class based on spectral similarity using Metabolon Inc.’s annotation protocols, pending confirmation by a standard. CD: Crohn’s disease, HC: match control; OR: odds ratio, X indicates unknown metabolites; SD: standard deviation.
Figure 2.
Figure 2.
Assessment of potential confounding effect of pre-disease biomarkers on metabolites associated with the risk of developing CD. (A) Volcano plots showing the Fold change of each CD associated metabolite after adjustment for LMR or FCP or as or CRP, or Shannon index covariates separately. Red dots represent significantly increased metabolites in pre-CD group (q-value < 0.05, OR > 1), blue dots represent significantly decreased metabolites in the pre-CD group (q-value < 0.05, OR < 1). Black dots represent metabolites not significant after covariate adjustment. (B) heatmap of the -log10(q-value) of the pre-CD metabolites adjusting for the covariates listed in (A) individually. The left y-axis of the heatmap displays the names of the CD-associated metabolites, with sub-pathways indicated by colors on the right. The x-axis lists the covariates included in the conditional logistic regression. The red intensity of the heatmap squares is proportional to the -log10 of the q-value. A darker red tone indicates higher significance, while a white square indicates non-significant associations (q-value > 0.05). Feature names include known metabolites and unknowns labeled with “X”- identifiers. ** indicates a compound putatively identified by Metabolon Inc. through matching to its proprietary spectral libraries and orthogonal analytical evidence without a chemical standard; * indicates a compound putatively characterized to a chemical class based on spectral similarity using Metabolon Inc.’s annotation protocols, pending confirmation by a standard. CD: Crohn’s disease; X- indicates unknown but defined compounds; OR: odd ratio. FCP: fecal calprotectin; LMR: lactulose-to-mannitol ratio; CRP: C-reactive protein; AS: serum antimicrobial antibody sum.
Figure 3.
Figure 3.
Heatmap of Spearman correlation coefficient between serum proteins, microbiome and clinical variables and CD associated metabolites. Partial Spearman’s rank correlation accounts for the matching conditions (age, sex assigned at birth, country, and follow-up duration), CD-multiplex family, and relation to proband (sibling vs offspring). Only correlations with q-value < 0.05 are represented by a star*; the Y-axis represents the 63 pre-CD associated metabolites. The x-axis represents previous biomarkers of CD. Blue labeling indicates biomarkers associated with decreased risk of CD, while red labels indicate biomarkers associated with increased risk of CD (see methods). The color intensity indicates the coefficient of correlation from red (indicating positive correlation) to blue (indicating negative correlation). Feature names include known metabolites and unknowns labeled with “X”- identifiers. ** indicates a compound putatively identified by Metabolon Inc. through matching to its proprietary spectral libraries and orthogonal analytical evidence without a chemical standard; * indicates a compound putatively characterized to a chemical class based on spectral similarity using Metabolon Inc.’s annotation protocols, pending confirmation by a standard. CD: Crohn’s disease; FCP: fecal calprotectin; LMR: lactulose-to-mannitol ratio; CRP: C-reactive protein; AS: serum antimicrobial antibody sum.
Figure 4.
Figure 4.
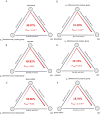
Bidirectional mediation analysis of Ruminococcus torques and its associated metabolites in CD risk. Each panel illustrates one direction of the mediation model: (A – C) Ruminococcus torques relative abundance influencing CD through the metabolites, and (D – F) metabolites influencing CD through the relative abundance of Ruminococcus torques. The numerical values along the borders of the triangle represent the effect sizes (β) from the mediator or outcome models, along with their corresponding P-values. The percentage inside the triangle indicates the proportion mediated, calculated as ACME/(ACME + ADE). Pmed represents the statistical significance of the mediation (i.e., indirect) effect estimated via 1,000 bias-corrected bootstrap simulations. All models were adjusted for age, sex, and country. CD, Crohn’s disease; ACME, average causal mediation effect; ADE, average direct effect; β, regression coefficient; Pmedi, P-value for the mediation effect.
Figure 5.
Figure 5.
Performance of the metabolite-based Random Forest model for CD prediction using nested cross-validation. (A) model performance measured by AUC across varying numbers of features, evaluated using nested CV. The red line shows the mean AUC, with the shaded area representing standard deviation across five folds. The vertical dashed blue line marks the optimal model with 1006 features (AUC = 0.9007), while a more practical model using 128 features (AUC = 0.8856) is also highlighted. Each dot represents the AUC result from one of the five cross-validation folds. The red line indicates the mean AUC, and the shaded area represents the 95% confidence interval (CI). (B) ROC curve for the model using 128 selected features, yielding an average AUC of 0.8856 across five CV folds. The dashed line represents the mean performance under random classification (AUC = 0.5). (C) top 20 most important features (out of the 128 selected), ranked by mean feature importance across five CV folds. Bar lengths indicate mean importance, and the percentages on the right represent the proportion of folds in which each feature was selected (e.g., 100% = selected in all five folds; 20% = selected in one Fold). Feature names include known metabolites and unknowns labeled with “X”- identifiers. CD, Crohn’s disease; AUC, area under the curve; ROC, receiver operating characteristic.

References

    1. Ng SC, Shi HY, Hamidi N, Underwood FE, Tang W, Benchimol EI, Panaccione R, Ghosh S, Wu JCY, Chan FKL, et al. Worldwide incidence and prevalence of inflammatory bowel disease in the 21st century: a systematic review of population-based studies. Lancet. 2017;390(10114):2769–18. doi: 10.1016/S0140-6736(17)32448-0. - DOI - PubMed
    1. Lloyd-Price J, Arze C, Ananthakrishnan AN, Schirmer M, Avila-Pacheco J, Poon TW, Andrews E, Ajami NJ, Bonham KS, Brislawn CJ, et al. Multi-omics of the gut microbial ecosystem in inflammatory bowel diseases. Nature. 2019;569(7758):655–662. doi: 10.1038/s41586-019-1237-9. - DOI - PMC - PubMed
    1. Turpin W, Espin-Garcia O, Xu W, Silverberg MS, Kevans D, Smith MI, Guttman DS, Griffiths A, Panaccione R, Otley A, et al. Association of host genome with intestinal microbial composition in a large healthy cohort. Nat Genet. 2016;48(11):1413–1417. doi: 10.1038/ng.3693. - DOI - PubMed
    1. Lee SH, Turpin W, Espin-Garcia O, Raygoza Garay JA, Smith MI, Leibovitzh H, Goethel A, Turner D, Mack D, Deslandres C, et al. Anti-microbial antibody response is associated with future onset of Crohn’s disease independent of biomarkers of altered gut barrier function, subclinical inflammation, and genetic risk. Gastroenterology. 2021;161(5):1540–1551. doi: 10.1053/j.gastro.2021.07.009. - DOI - PubMed
    1. Xue M, Leibovitzh H, Jingcheng S, Neustaeter A, Dong M, Xu W, Espin-Garcia O, Griffiths AM, Steinhart AH, Turner D, et al. Environmental factors associated with risk of Crohn’s disease development in the Crohn’s and Colitis Canada - genetic, environmental, microbial Project. Clin Gastroenterol Hepatol. 2024;22(9):1889–1897.e12. doi: 10.1016/j.cgh.2024.03.049. - DOI - PubMed

MeSH terms

LinkOut - more resources