. 2025 Sep;533(9):e70087.
doi: 10.1002/cne.70087.

The Organization of Central Retinal Projections in Anna's Hummingbirds (Calypte anna) and Zebra Finches (Taeniopygia castanotis)

Affiliations

The Organization of Central Retinal Projections in Anna's Hummingbirds (Calypte anna) and Zebra Finches (Taeniopygia castanotis)

Cristián Gutiérrez-Ibáñez et al. J Comp Neurol. 2025 Sep.

Abstract

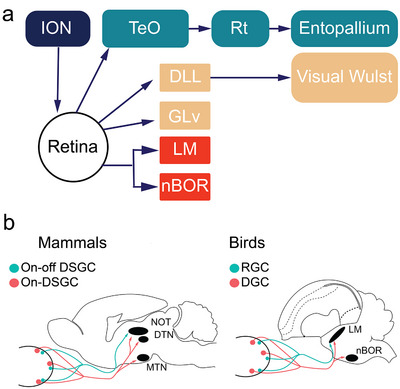
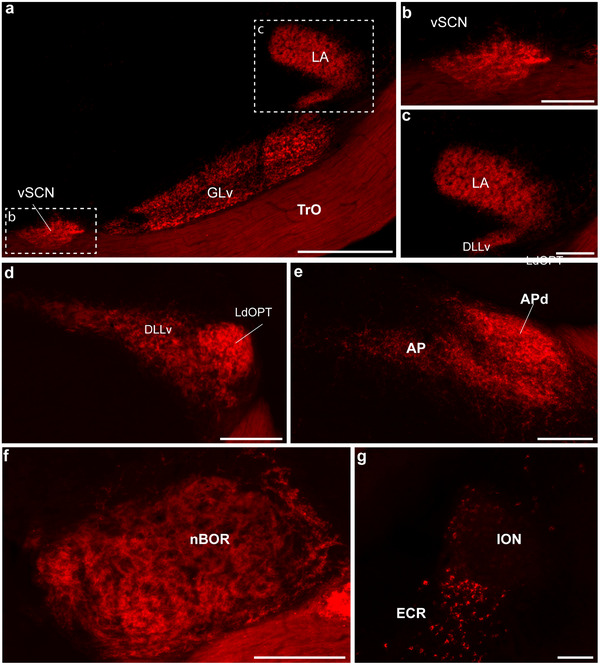
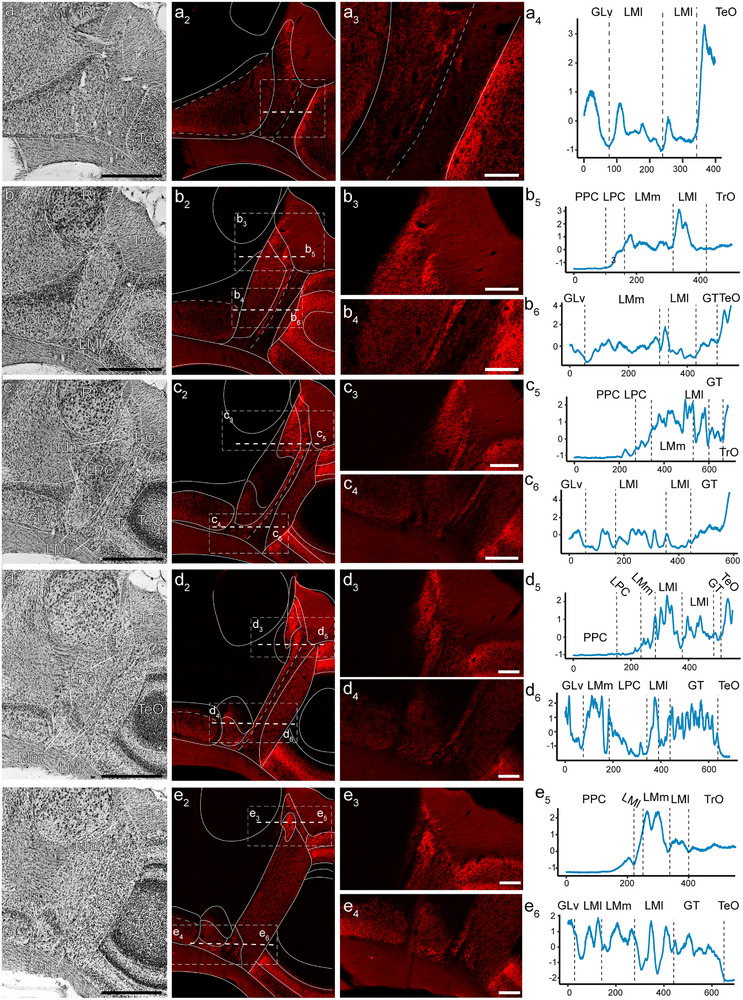
Hummingbirds (family Trochilidae) are easily recognized due to their unique ability to hover. Critical to hovering flight is head and body stabilization. In birds, stabilization during flight is mediated, among other things, by the detection of optic flow, the motion that occurs across the entire retina during self-motion. Given this increased requirement for stabilization, it is not surprising that previous studies have shown that hummingbirds have neural specializations in the visual pathways involved in the detection of optic flow. Particularly, previous studies have found some structural and functional differences in the hummingbird brain, in the pretectal nucleus lentiformis mesencephali (LM): compared to other avian species, LM shows a massive hypertrophy, and LM neurons have unique response properties to optic flow stimuli. Here, we used intraocular injections of a neural tracer, cholera toxin subunit B (CTB) conjugated with a fluorescent molecule, to study the retinal projections in Anna's hummingbirds (Calypte anna) and compare them to those of a similarly sized non-hovering species, the zebra finch (Taeniopygia castanotis). Retinal targets in both birds were similar and correspond closely to those reported in other birds from a variety of avian clades. Importantly, we found differences in the projections to LM between hummingbirds and zebra finches. Consistent with previous reports of specialization of LM, it was more intensely labelled compared to other retinal-recipient nuclei in hummingbirds. Moreover, this increase in intensity was most apparent in the lateral subnucleus. This study reinforces previous evidence that the LM of hummingbirds is adapted to sustain the unique flight abilities of this clade.

Keywords: avian; optic flow; optic tectum; retina; visual system.


Conflict of interest statement

The authors declare no conflict of interest.

Figures

FIGURE 1
FIGURE 1
Visual pathways in birds. (a) A reduced schematic shows the three major visual pathways in birds. The tectofugal pathway is shown in green, and the thalamofugal pathway is shown in yellow. (b) Two schematics compare the retinal inputs to the accessory optic system (AOS) and the pretectum in birds and mammals. In birds, displaced ganglion cells (DGCs) project to the nucleus of the basal optic root (nBOR), part of the AOS, and to the pretectal nucleus lentiformis mesencephali (LM). Additionally, LM receives projections from some regular retinal ganglion cells (RGCs). In mammals, the medial and dorsal terminal nuclei (MTN and DTN, respectively), which are part of the AOS, and the pretectal nucleus of the optic tract (NOT), receive projections from a specific type of direction‐selective RGCs (DSGCs). NOT additionally receives projections from a second type of retinal ganglion cells, ON–OFF DSGCs (Dhande et al. 2013). AOS accessory optic system; dLGN dorsal lateral geniculate nucleus; LM nucleus lentiformis mesencephali; MTN medial terminal nucleus; nBOR nucleus of the basal optic root; NOT nucleus of the optic tract.
FIGURE 2
FIGURE 2
Retinal projections to the optic tectum in the zebra finch and the Anna's hummingbird. (a, b) show the projection pattern of retinal terminals in the contralateral thalamus and optic tectum of the zebra finch and the Anna's hummingbird, respectively. The retinal projections labeled with fluorescent conjugated cholera toxin subunit B are superimposed over Nissl‐stained sections. The separation between sections ranges from 240 to 480 µm. Importantly, the entire TeO is labeled, which confirms that the tracer was taken up by the whole extent of the retina in both species. Scale bars = 2 mm.
FIGURE 3
FIGURE 3
The main targets of the retinal projections in the brain of the zebra finch and Anna's hummingbird. (a–e). Each panel shows a schematic of the CTB‐labeled terminals in coronal sections through the midbrain of a zebra finch brain, presented anterior to posterior. (f–j) show the same, but for the Anna's hummingbird. Next to each schematic, there is a microphotograph of the corresponding section showing the CTB‐labeled terminals. The different shades of red in the schematic represent the intensity of the terminals. Striped areas correspond to the optic tract. In both species, similar retinorecipient areas were observed. This includes the ventral suprachiasmatic nucleus (vSCN), the thalamic ventrolateral geniculate complex, which includes the lateralis anterior thalami (LA), the ventral geniculate nucleus (GLv), and the n. marginalis tractus optici (nMOT). The dorsolateral geniculate complex (GLd), the pretectum (LMm, LMl, GT, AP, APd), the accessory optic system (nBOR), and the optic tectum (TeO). Also visible is the centrifugal isthmo‐optic tract (TIO). For abbreviations, see the list. Scale bars: 1 mm for schematics, 200 µm for microphotographs.
FIGURE 4
FIGURE 4
Representative photomicrographs of the main contralateral retinorecipient areas in the zebra finch. All pictures are from coronal sections. (a) Terminals in the ventral geniculate nucleus (GLv) and the visual suprachiasmatic nucleus (vSCN). (b) A higher magnification microphotograph of the inset in a, with details of the terminals in vSCN. (c) Terminals in the lateralis anterior thalami (LA). (d) Terminals in the ventral part of the nucleus dorsolateralis anterior thalami, pars lateralis (DLL), and the nucleus lateralis dorsalis optici principalis thalami (LdOPT), as well as in the more medially located nucleus suprarotundus (SpRt). Terminals can also be seen in the lateral part of the nucleus lentiformis mesencephali and the rostral part of the tectal grey (GTr). (e) A higher magnification microphotograph of the area in the inset in (d). Here, terminals can be seen in the medial‐most edge of the nucleus rotundus (Rt), which corresponds to the nucleus marginalis tractus optici (nMOT). (f) A higher magnification microphotograph of the area in the inset in (d), showing details of terminals in DLLv and LdOPT. (g) Terminals in the area pretectalis (AP). (h) Terminals in the nucleus of the basal optic root (nBOR) and the adjacent ventral part of the GTr. (i) Retrogradely labeled cells in the isthmo optic nucleus (ION). Scale bars: (a) = 200 µm; (b) and (g) = 50 µm; (e, f, and i) = 100 µm; (d, g) = 500 µm.
FIGURE 5
FIGURE 5
Representative photomicrographs of the main contralateral retinorecipient areas in the Anna's Hummingbird. All pictures are from coronal sections. (a) Terminal in the ventral geniculate nucleus (GLv), the visual suprachiasmatic nucleus (vSCN), and the nucleus lateralis anterior thalami (LA). (b, c) show a higher magnification microphotograph of the insets in (a), with details of the terminals in vSCN and LA, respectively. (d) Terminals in the ventral part of the nucleus dorsolateralis anterior thalami, pars lateralis (DLL), and the nucleus lateralis dorsalis optici principalis thalami (LdOPT). (e) Terminals in the area pretectalis (AP) and its dorsal part (APd). (f) Terminals in the nucleus of the basal optic root (nBOR) and adjacent areas. (g) Retrogradely labeled cells in the isthmo optic nucleus (ION) and the adjacent ectopic cell region. Scale bars: (a) = 300 µm, (b, g = 50 µm, (c, e, f, and i) = 100 µm, (d, g) = 500 µm.
FIGURE 6
FIGURE 6
Retinal projections to the optic tectum in the zebra finch and the Anna's hummingbird. (a) Representative coronal sections through the optic tectum in the side contralateral to the eye injected with the tracer in a zebra finch (ZF). Numbers represent the optic tectum layers. (b–d) A higher magnification microphotograph of the insets in (a). Each shows the retinorecipient layers and optic track in three different areas of the optic tectum (dorsal, middle, and ventral, respectively). Next to each panel is a plot of the standardized labeling intensity of a line perpendicular to the orientation of the layers. The thick dotted line shows the border of the optic tract with layer 1, while the thinner dotted line shows the corresponding borders for each layer. (e–h) Same as above, but for the Anna's hummingbird (AH). Intensity was standardized and centered within each line. Scale bars: (a–e) = 500 µm, all others 100 µm.
FIGURE 7
FIGURE 7
Retinal projections to the nucleus lentiformis mesencephali in the zebra finch. a1–e1 show a series organized anterior to posterior of Nissl‐stained coronal sections through the nucleus lentiformis mesencephali in the side contralateral to the eye injected with tracer. (a2–e2) A fluorescent microphotograph of the same section in a1–e1, showing the retinal terminals. Dotted lines represent the areas where the intensity of the terminal labeling was measured. Panels a3–e3 and b4–e4 show a higher magnification microphotograph of the regions where the labeling intensity was measured. Next to each of these panels (a4, b5–e5 and b6–e6) is the intensity labeling across the horizontal dotted line shown in the corresponding section (Panels, a–e2). Intensity was standardized and centered within each line. For abbreviations, see the abbreviation list. Scale bars: (a1–e2) = 500 µm, all others 100 µm.
FIGURE 8
FIGURE 8
Retinal projections to the nucleus lentiformis mesencephali in the Anna's hummingbird. a1–e1 show a series from anterior to posterior of Nissl‐stained coronal sections through the nucleus lentiformis mesencephali in the side contralateral to the eye that received a tracer injection. (a2–e2) A fluorescent microphotograph of the same sections in (a1–e1), showing the retinal terminals. Dotted lines represent the areas where the intensity of the terminal labeling was measured. Panels (a3–e3) and (b4–e3) show a higher magnification microphotograph of the areas where the labeling intensity was measured. Next to each of these panels (a4–b4, c5–c6, d5, and e4) is a plot showing the intensity of labeling in the horizontal area demarcated by a dotted line in the corresponding section. Intensity was standardized and centered within each line. Scale bars: (a1–e2) = 500 µm, all other 100 µm.
FIGURE 9
FIGURE 9
Standardized labeling intensity across retinorecipient nuclei. Violin plots of the labeling intensity after an injection in the eye of cholera toxin subunit B conjugated with a fluorescent molecule in the zebra finch (a) and the Anna's hummingbird (b) for five retinorecipient areas. Intensity values were standardized and centered within a species and a single case. Different numbers of asterisks indicate significant differences between different retinorecipient areas within each species. See the results and the abbreviation list.
FIGURE 10
FIGURE 10
Ipsilateral projections from the retina in the zebra finch and Anna's hummingbird. All pictures are from coronal sections. (a) The nucleus lateralis anterior thalami (LA) of the zebra finch. (b) Terminals in the dorsal area of the lateral part of the ipsilateral nucleus lentiformis mesencephali (LMl), (c) A higher magnification microphotograph of the inset in (b), with details of the terminals in LMl. (d) Terminals in the ipsilateral nucleus of the basal optic root (nBOR) of the zebra finch. (e) Retinal terminals in the ipsilateral nucleus lateralis anterior thalami (LA) of the Anna's hummingbird. (f) Terminals in the ipsilateral nucleus dorsolateralis anterior thalami, pars lateralis (DLL) of the Anna's hummingbird. (g) Terminals in the ipsilateral nucleus of the basal optic root (nBOR) and the adjacent area. Scale bars: (a–f) = 100 µm; (g) = 200 µm.

Similar articles

References

    1. Altshuler, D. L. , and Dudley R.. 2002. “The Ecological and Evolutionary Interface of Hummingbird Flight Physiology.” Journal of Experimental Biology 205: 2325–2336. - PubMed
    1. Baliga, V. B. , Dakin R., Wylie D. R., and Altshuler D. L.. 2024. “Hummingbirds Use Distinct Control Strategies for Forward and Hovering Flight.” Proceedings of the Royal Society B: Biological Sciences 291: 20232155. - PMC - PubMed
    1. Beer, G. D 1974. Homology, an Unsolved Problem. Carolina Biological Supply Company.
    1. Bellintani‐Guardia, B. , and Ott M.. 2002. “Displaced Retinal Ganglion Cells Project to the Accessory Optic System in the Chameleon (Chamaeleo calyptratus).” Experimental Brain Research 145: 56–63. - PubMed
    1. Benowitz, L. I. , and Karten H. J.. 1976. “Organization of the Tectofugal Visual Pathway in the Pigeon: A Retrograde Transport Study.” Journal of Comparative Neurology 167: 503–520. - PubMed

LinkOut - more resources