. 2025 Sep 5;20(9):e0328911.
doi: 10.1371/journal.pone.0328911. eCollection 2025.

Gene expression profiling and pathway analysis in acute myeloid leukaemia-normal karyotype patients

Affiliations

Gene expression profiling and pathway analysis in acute myeloid leukaemia-normal karyotype patients

Angeli Ambayya et al. PLoS One. .

Abstract

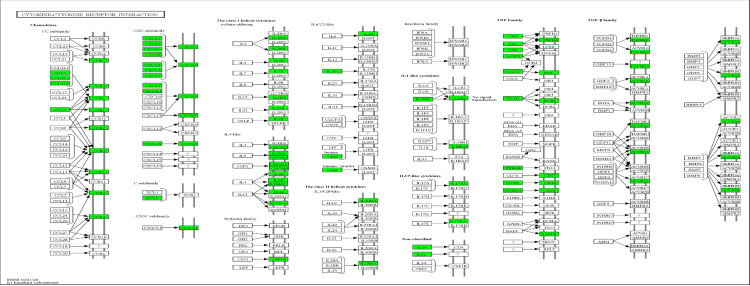
Acute myeloid leukaemia-normal karyotype (AML-NK) exhibits heterogeneity in expression profiles, influencing the treatment response and survival outcome. Transcriptome sequencing allows a comprehensive analysis of differentially expressed genes (DEGs) and dysregulated pathways in AML-NK, shedding light on the molecular mechanisms and their implications in patients' management. DEG analyses utilising transcriptome sequencing were conducted using a customised DESeq2 pipeline on 51 AML-NK patients at diagnosis (DX), 12 AML-NK patients who attained first remission (CR1) and 12 healthy controls. The transcriptomic sequencing of AML-NK compared to healthy controls revealed 5,126 DEGs, comprising 85.8% coding genes and 14.2% non-coding elements across 37 pathway categories. The AML-NK DX versus CR1 identified 5,621 DEGs consisting of 84.7% coding genes and 15.3% non-coding elements affecting 20 categories of pathways. Gene set enrichment analysis in this study revealed consistent upregulation of proliferative pathways, including cell cycle and DNA replication. In contrast, immune-related pathways, such as cytokine-cytokine receptor interactions and MHC antigen presentation pathways, were downregulated. Overexpression of oncogenes (FLT3, MYB, DNMT3B, and MYCN) in DX vs CR1 samples reinforces their usefulness in minimal residual disease monitoring, especially in AML-NK with no genetic aberrations. These findings reiterate the known hallmarks of cancers and validate the transcriptomic dysregulation in the pathogenesis of AML-NK. The robustness of the transcriptome sequencing findings was confirmed by RT-qPCR validation of six genes that were not reported in AML-NK patients. The comprehensive analyses of pathways with dysregulation of a myriad of genes led to an understanding of AML-NK pathogenesis and highlighted the markers for minimal residual disease. In summary, this study performed the first transcriptome-wide analysis of AML-NK in a Malaysian cohort and underscored pathways that are candidates for therapeutic interventions.


Conflict of interest statement

All authors declare that there is no competing interest.

Figures

Fig 1
Fig 1. GSEA analysis of AML-NK patients vs healthy controls bar chart.
The bar chart depicts significantly enriched pathways in the GSEA analysis of AML-NK patients versus healthy controls. The bar width equals the enrichment ratio, with blue indicating positively related categories and orange indicating negatively related categories in the GSEA analysis. This figure was generated using the WebGestalt tool [24].
Fig 2
Fig 2. Cell cycle pathway (hsa04110).
In this analysis, 56 genes were affected with a NES of 2.81. The image was generated using KEGG Mapper (copyright permission obtained from Kanehisa Laboratories) [27]. All the upregulated genes (red boxes) in the cell cycle pathway are seen in different phases of cell cycles, including G1-phase, S-phase, G2-phase, and M-phase.
Fig 3
Fig 3. Cytokine-cytokine receptor interaction (hsa04060).
Ninety-nine genes comprising various interleukin classes with NES of −3.00 were affected. All the downregulated genes are coloured in green boxes. Upstream genes in the two major chemokines subfamilies of CC and CXC are affected. The image was generated using KEGG Mapper (copyright permission obtained from Kanehisa Laboratory) [27].
Fig 4
Fig 4. Hierarchical clustering heatmap of AML-NK DX and CR1 samples.
The heat map depicts the correlations between the DX and their CR1 samples by the colour-coded gradient between green, indicating downregulation, and red, indicating upregulation.
Fig 5
Fig 5. Bar chart depicting significantly enriched pathways in the GSEA analysis of AML-NK DX and CR1 samples.
The bar width equals the enrichment ratio, with blue indicating positively related categories and orange indicating negatively related categories in GSEA analysis. Ten categories were positively enriched, of which eight had a p-value, FDR below 0.05, and two other pathways (mismatch repair and nucleotide excision repair) had a p-value of below 0.05 and FDR above 0.05. Ten pathways had a p-value and FDR below 0.05 in the negatively enriched category. This figure was generated using the WebGestalt tool [1].
Fig 6
Fig 6. DNA replication (hsa03030) pathway.
Cytokine-cytokine receptor interaction (hsa04060) was the most negatively enriched significant pathway in this cohort’s GSEA analysis of 12 paired DX and CR1 AML-NK patients (not shown). Twenty genes were upregulated with NES of 2.5076. All the upregulated genes (red boxes) are involved in the DNA replication.Upstream genes of DNA polymerase α, δ and ε involved in nuclear DNA replication were upregulated. The upstream genes in the MCM complex that controls the cell cycle DNA replication were also upregulated, as shown in red boxes. DNA2, FEN1, and DNA ligase (Lig1) essential for DNA replication were upregulated. The image was generated using KEGG Mapper (copyright permission obtained from Kanehisa Laboratories) (Kanehisa, 2000). This figure was generated using the WebGestalt tool [24].

Similar articles

References

    1. Döhner H, Weisdorf DJ, Bloomfield CD. Acute Myeloid Leukemia. N Engl J Med. 2015;373(12):1136–52. doi: 10.1056/NEJMra1406184 - DOI - PubMed
    1. Mawad R, Estey EH. Acute myeloid leukemia with normal cytogenetics. Curr Oncol Rep. 2012;14(5):359–68. doi: 10.1007/s11912-012-0252-x - DOI - PubMed
    1. Grimwade D, Haferlach T. Gene-expression profiling in acute myeloid leukemia. N Engl J Med. 2004;350(16):1676–8. doi: 10.1056/NEJMe048040 - DOI - PubMed
    1. Grimwade D, Hills RK. Independent prognostic factors for AML outcome. Hematol Am Soc Hematol Educ Program. 2009;:385–95. doi: 10.1182/asheducation-2009.1.385 - DOI - PubMed
    1. Medinger M, Passweg JR. Acute myeloid leukaemia genomics. Br J Haematol. 2017;179(4):530–42. doi: 10.1111/bjh.14823 - DOI - PubMed