

Artificial vision models for the identification of Mediterranean flora: An analysis in four ecosystems
- PMID: 40911662
- PMCID: PMC12413090
- DOI: 10.1371/journal.pone.0327969
Artificial vision models for the identification of Mediterranean flora: An analysis in four ecosystems
Abstract
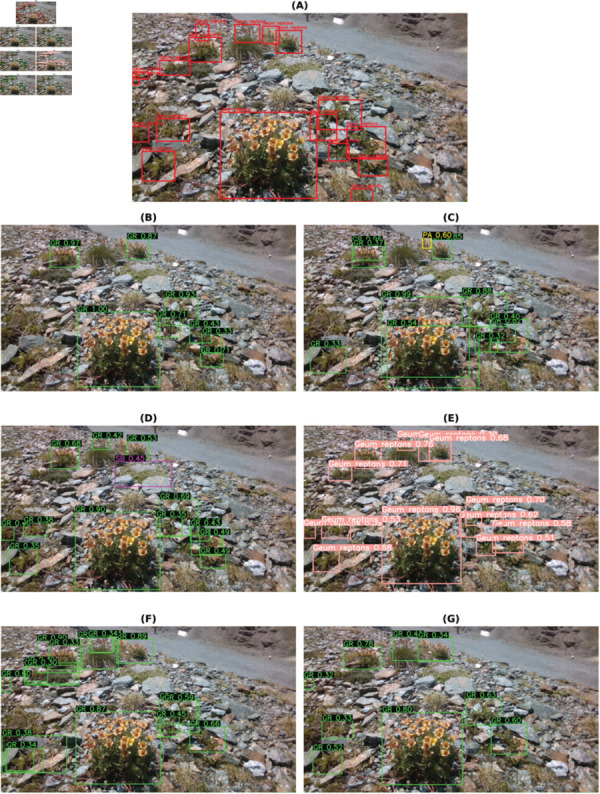
Object identification has been widely used in several applications, utilising the annotated data with bounding boxes to specify each object's exact location and category in images and videos. However, relatively little research has been conducted on identifying plant species in their natural environments. Natural habitats play a crucial role in preserving biodiversity, ecological balance, and overall ecosystem health. So, effective monitoring of habitats is necessary for safeguarding them, and one way of doing this is by identifying the typical and early warning plant species. Our study quantitatively evaluates the performance of six popular object detection models on our dataset collected in the wild, comprising various plant species from four habitats: screes, dunes, grasslands, and forests. The dataset employed in this work includes the data collected by human operators and the quadrupedal robot ANYmal C. The pre-trained object detection models have been chosen for experiments, and they are fine-tuned on our dataset to achieve better performance. These models incorporate two one-stage (RetinaNet and YOLOv8n), two two-stage (Faster RCNN and Cascade RCNN), and two transformer-based detectors (DETR and Deformable DETR). Extensive experimentation has been performed on the four habitat datasets by applying class balancing and hyperparameter tuning, and the obtained results are discussed.
Copyright: © 2025 Kaur et al. This is an open access article distributed under the terms of the Creative Commons Attribution License, which permits unrestricted use, distribution, and reproduction in any medium, provided the original author and source are credited.
Conflict of interest statement
The authors have declared that no competing interests exist.
Figures


References
-
- Cowling RM, Knight AT, Faith DP, Ferrier S, Lombard AT, Driver A, et al. Nature conservation requires more than a passion for species. Conservation Biology. 2004;18(6):1674–6. doi: 10.1111/j.1523-1739.2004.00296.x - DOI
-
- Bunce RGH, Bogers MMB, Evans D, Halada L, Jongman RHG, Mucher CA, et al. The significance of habitats as indicators of biodiversity and their links to species. Ecological Indicators. 2013;33:19–25. doi: 10.1016/j.ecolind.2012.07.014 - DOI
-
- Berg C, Abdank A, Isermann M, Jansen F, Timmermann T, Dengler J. Red lists and conservation prioritization of plant communities – a methodological framework. Applied Vegetation Science. 2014;17(3):504–15. doi: 10.1111/avsc.12093 - DOI
-
- Keith DA, Rodríguez JP, Brooks TM, Burgman MA, Barrow EG, Bland L, et al. The IUCN red list of ecosystems: motivations, challenges, and applications. Conservation Letters. 2015;8(3):214–26. doi: 10.1111/conl.12167 - DOI
MeSH terms
LinkOut - more resources
Full Text Sources
