. 2025 Sep 5;11(36):eadt6083.
doi: 10.1126/sciadv.adt6083. Epub 2025 Sep 5.

Mechanosensitive biochemical imprinting of the talin interaction with DLC1 regulates RhoA activity and cardiomyocyte remodeling

Affiliations

Mechanosensitive biochemical imprinting of the talin interaction with DLC1 regulates RhoA activity and cardiomyocyte remodeling

Emilie Marhuenda et al. Sci Adv. .

Abstract

During heart disease, the cardiac extracellular matrix (ECM) undergoes a structural and mechanical transformation. Cardiomyocytes sense the mechanical properties of their environment, leading to phenotypic remodeling. A critical component of the ECM mechanosensing machinery, including the protein talin, is organized at the cardiomyocyte costamere. Our previous work indicated a different talin tension, depending on the ECM stiffness, but the effects on downstream signaling remained elusive. Here, we identify that the talin interacting proteins DLC1 (deleted in liver cancer 1), RIAM (Rap1-interacting adaptor molecule), and paxillin each preferentially bind to talin at a specific ECM stiffness, this interaction is preserved in the absence of tension, and the interaction is regulated through focal adhesion kinase signaling. Moreover, DLC1 regulates cardiomyocyte RhoA activity in a stiffness-dependent way, whereby the loss of DLC1 results in myofibrillar disarray. Together, this study demonstrates a mechanism of imprinting mechanical information into the talin interactome to fine-tune RhoA activity, with impacts on cardiac health and disease.


Figures

Fig. 1.
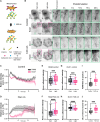
Fig. 1.. DLC1 and RIAM bind to talin in a stiffness-dependent way.
(A) Schematic of talin 1 with protein interactions [only interactions that are relevant for this manuscript are shown, see also Calderwood et al. (72)]. Vinculin binding helices are shown in light green. (B) Coimmunoprecipitation (co-IP) analysis for talin interactions. Neonatal rat cardiomyocytes were cultured on polydimethylsiloxane (PDMS) surfaces with the indicated stiffness for 7 days before immunoprecipitation with an anti-talin antibody. Samples were then subjected to Western blotting and probed with antibodies against paxillin, RIAM and DLC1, indicating preferential binding at 1 kPa (paxillin), 6 kPa (DLC1), and 20 kPa (RIAM). Inp, input; IP, immunoprecipitation. (C) Quantification of the data in (B) from three independent biological repeats. (D and E) Fluorescence recovery after photobleaching (FRAP) assays of DLC1 (D) and RIAM (E) in neonatal rat cardiomyocytes, from three independent biological repeats with 25 (DLC1 6 kPa), 36 (DLC1 20 kPa), 36 (DLC1 130 kPa), 33 (RIAM 6 kPa), 29 (RIAM 20 kPa), and 31 (RIAM 130 kPa) cells quantified per condition. (F and G) Average recovery curves (means + SEM). (H) Quantification recovery half-time and plateau (mobile fraction) for DLC1 and (I) RIAM. *P < 0.05; **P < 0.01; ***P < 0.001; ****P < 0.0001, one-way analysis of variance (ANOVA) with Tukey correction for multiple comparisons (C) or unpaired t test (H and I).
Fig. 2.
Fig. 2.. DLC1 and RIAM binding to talin is altered in vivo in heart disease.
(A and B) Nanoindentation measurement of sections from WT and MLP knockout hearts. Sections (20-μm thick) of n = 3 hearts each were measured using a nanoindenter (tip radius = 49 μm, stiffness = 0.49 N/m, and indentation depth = 2 μm). (A) Stiffness map overlaid over the bright-field image. Empty squares indicate areas where the measurement failed, possibly due to uneven topography. (B) Quantification. ****P < 0.0001, unpaired t test after logarithmic transformation of the (log-normal distributed) data. (C to F) In situ proximity ligation (PL) assays were performed on sections from WT and MLP knockout hearts with DLC1 and talin (C) and RIAM and talin antibodies (D); n = 3 animals each. (E and F) Integrated intensity of proximity labels were normalized by the number of nuclei per image, and >5 images were quantified per heart. Data are presented as mean per animal, normalized by the mean of all images of the respective repeat. **P < 0.01, unpaired t test.
Fig. 3.
Fig. 3.. The talin interactome is regulated through phosphorylation.
(A) Co-IP analysis for talin interactions. Neonatal rat cardiomyocytes were cultured on PDMS with 6 kPa stiffness for 7 days, treated with the indicated inhibitors, and immunoprecipitated with an anti-talin antibody. Samples were then subjected to Western blotting and probed with antibodies against paxillin, RIAM, and DLC1, indicating changes in the talin interactions after FAK and SFK inhibition (inh). (B) Quantification from three independent repeats. (C to H) FRAP assays of DLC1 (C, E, and G) and RIAM (D, F, and H) in neonatal rat cardiomyocytes from three independent biological repeats, with 25 [DLC1 6 kPa control (Co); see Fig. 1], 21 (DLC1 6 kPa FAK inh), 33 (RIAM 6 kPa Co; see Fig. 1), and 25 (RIAM 6 kPa FAK inh) cells quantified per condition. (C and D) Average recovery curves (means + SEM). (E to H) Quantification of recovery half-time and plateau (mobile fraction) for DLC1 (E and G) and RIAM (F and H). *P < 0.05; **P < 0.00; ***P < 0.001, one-way ANOVA with Tukey correction for multiple comparisons (B) or unpaired t test (E to H). n.s., not significant.
Fig. 4.
Fig. 4.. DLC1 and RIAM directly compete for talin binding in vitro.
FP binding and competition experiments of purified talin R7R8 with DLC1 TBS, RIAM TBS1, and paxillin LD1 synthetic peptides. (A) Overlay of the crystal structures of talin 1 R8 (gray) in complex with DLC1 TBS (blue, pdb 5FZT) and RIAM TBS1 (orange, pdb 4W8P) peptides, showing that the binding site for the two peptides overlap. (B) FP binding curves of purified R7R8 with TBS-F (blue, Kd = 4.92 ± 0.76 μM), RIAM TBS1 (orange, Kd = 9.21 ± 2.16 μM), or paxillin LD1 [green, not determined (ND)]. For clarity, the fluorescein-labeled peptides are designated with a “-F” in the figure. (C) FP competition experiment of R7R8 complexed with DLC1 TBS-F in competition with unlabeled RIAM TBS1. Increasing amounts of unlabeled RIAM peptide outcompetes the labeled DLC1 TBS-F as seen by a decrease in polarization [orange, inhibitory constant (Ki) = 90 ± 48 μM]. The R7R8-DLC1 TBS-F complex could not be outcompeted with unlabeled paxillin LD1 (green). No changes in signal were observed when DLC1 TBS-F was titrated with unlabeled RIAM TBS1 peptide (black).
Fig. 5.
Fig. 5.. DLC1 and RIAM directly compete for talin binding in cells.
(A) Schematic of the LOVTRAP system. Illumination with blue light converts the LOV domain into the light state and displaces the dark-state binding Zdk tag and associated molecule (here, RIAM) from the mitochondria to enable adhesion binding. (B) Imaging of cells with a blue laser immediately displaces RIAM from a mitochondria localization (RIAM channel, magenta inset), leading to increased adhesion binding of RIAM and reduced adhesion binding of DLC1 (green inset and time series on right); the dynamics is changed after FAK inhibition. (C and D) Average time intensity curves of adhesions from 15 cells from three independent repeats for control and FAK inhibition, respectively. (E to H) Adhesion intensities (normalized to whole cell intensities) at the time of peak adhesion enrichment for RIAM, displayed as box plots, and changes for each cell from three independent repeats and >5 cells quantified per repeat. (I) Time for RIAM to reach peak intensity at adhesion. (J) Time for DLC1 to return to initial intensity before stimulation. *P < 0.05; **P < 0.01; ***P < 0.001; ****P < 0.0001, paired t test.
Fig. 6.
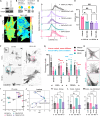
Fig. 6.. Loss of DLC1 leads to a stiffness-dependent reduction in RhoA activity and sarcomeric organization.
(A) DLC1 siRNA validation. (B) Schematic of RhoA biosensor (44). RBD, Rho binding domain. (C) Example fluorescence lifetime images from three independent, biological repeats and nine cells each; (D) distribution of lifetimes per pixel; TRAF, Tumor Necrosis Factor (TNF) receptor-associated factors domain, which is inserted between the FRET pair as no FRET control. (E) peak lifetime after log-normal fit, averaged per repeat; (F) α-actinin staining in neonatal rat cardiomyocytes indicates a loss of sarcomeres after DLC1 knockdown (KD), quantified in (G) from three independent, biological repeats with 12 to 30 images quantified per condition. Examples for the different categories shown in (H), which are zooms into the areas indicated by boxes in (F). SFLS, stress-fiber like structures. (I) Principal component (PC) analysis of 52 “texture” measurements (i.e., 13 types with four measurement scales each) shows separation of 6 kPa DLC1 knockdown samples (numbers 7 to 9) from other groups. (J) Loading plot indicated Entropy, Contrast, and Angular 2nd Moment (multiple points each for the output from different measurement scales) to have the largest loading (i.e., correlation) with the principal components. (K to M) Texture measurements (mean per repeat from three independent repeats) for Entropy (K), Contrast (L), and Angular 2nd Moment (M), which had the largest loadings for the principal component analysis (see also fig. S8B and Materials and Methods for further explanation of measurements). *P < 0.05; **P < 0.01; ***P < 0.001; ****P < 0.0001, one-way ANOVA with Dunnett correction for multiple comparisons (E and K to M) or two-way ANOVA with Tukey correction for multiple comparisons (G).
Fig. 7.
Fig. 7.. Model of stiffness-dependent competition of talin interactome.
Stiffness-dependent integrin signaling leads to altered levels of FAK activation. On a healthy stiffness, DLC1 has a higher affinity for binding to the talin R8 domain compared to RIAM, possibly due to direct phosphorylation through FAK (48), and, thus, can modify the level of RhoA activity. In addition, FAK is predicted to phosphorylate talin, and the phosphorylation might further contribute to the regulation (64). On a fibrotic stiffness, lower FAK activity reduces DLC1 phosphorylation, and DLC1 is outcompeted by RIAM for talin R8 binding. Because of the importance of DLC1 for fine-tuning the levels of RhoA activity, this affects the cardiomyocyte maturity and disease progression.

References

    1. Ward M., Iskratsch T., Mix and (mis-)match - The mechanosensing machinery in the changing environment of the developing, healthy adult and diseased heart. Biochim. Biophys. Acta Mol. Cell Res. 1867, 118436 (2020). - PMC - PubMed
    1. Yamauchi M., Sricholpech M., Lysine post-translational modifications of collagen. Essays Biochem. 52, 113–133 (2012). - PMC - PubMed
    1. Ruotsalainen H., Sipila L., Kerkela E., Pospiech H., Myllyla R., Characterization of cDNAs for mouse lysyl hydroxylase 1, 2 and 3, their phylogenetic analysis and tissue-specific expression in the mouse. Matrix Biol. 18, 325–329 (1999). - PubMed
    1. Lopez B., Gonzalez A., Hermida N., Valencia F., de Teresa E., Diez J., Role of lysyl oxidase in myocardial fibrosis: From basic science to clinical aspects. Am. J. Physiol. Heart Circ. Physiol. 299, H1–H9 (2010). - PubMed
    1. Maki J. M., Lysyl oxidases in mammalian development and certain pathological conditions. Histol. Histopathol. 24, 651–660 (2009). - PubMed

MeSH terms